TUTORIAL: Color Fundamentals for Digital Content Creation, Visualization and Exploration
Thursday, April 4, 2019
A tutorial presented during the Human-Computer Interaction Lab 36th Annual Symposium
University of Maryland
Overview
We provide an overview of the fundamentals of color theory and approaches to color selection for digital content creation, visualization, and exploration. Our tutorial is intended for a broad audience of individuals interested in understanding the mysteries of color.
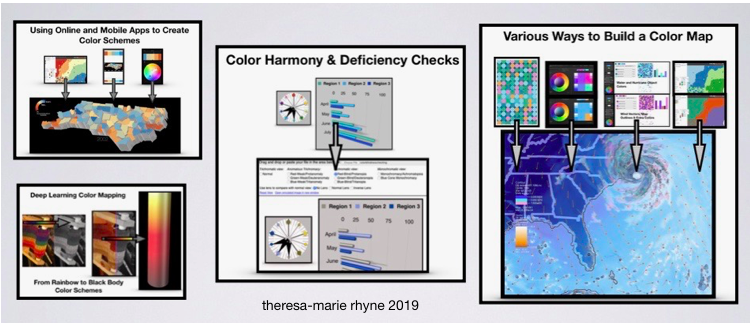
Our journey includes the introduction to the concepts of color models and harmony, a review of color vision principles, the definition of color gamut, spaces and systems and demonstrating online and mobile apps for performing color analyses of digital media. Freely available commercial and research tools for your continued use in color selection and color deficiency assessments are highlighted.
The tutorial includes concepts for art and design students such as extending the fundamental of the Bauhaus into digital media as well as a review of color perception and appearance principals for vision researchers. Newly emerging trends in automated color selection and deep learning colorization are also highlighted.
Organizer
Theresa-Marie Rhyne is an expert in the field of computer-generated visualization and a consultant who specializes in applying artistic color theories to visualization and digital media.
Her book Applying Color Theory to Digital Media and Visualization was published by CRC Press in 2016 and is recognized by librarians and color professionals as the best selling reference.
She has consulted with the Stanford University Visualization Group on a color suggestion prototype system, the Center for Visualization at the University of California at Davis and the Scientific Computing and Imaging Institute at the University of Utah on applying color theory to ensemble data visualization.
Prior to her consulting work, Theresa-Marie founded two visualization centers: (1) the United States Environmental Protection Agency’s Scientific Visualization Center and (2) the Center for Visualization and Analytics at North Carolina State University.