Catherine Plaisant

plaisant@umd.edu
NEWS
April 2022
I am now fully retired and not taking students or accepting paper review assignments
Oct 18, 2022:
Our 2002 paper on SpaceTree received the Infovis 2022 Test of Time Award
Oct 20, 2020:
The AVI keynote paper “The challenge of information visualization evaluation” was recognized by ACM SIGMM in Test of Time Awards for year 2004
Feb. 9, 2020:
Our EventAction paper received the ACM TiiS 2019 Best Paper Award
BOOKS
6th Edition (2016) Publisher website

Inspired EHRs: Designing for Clinicians (2014) by Belden, Patel, Lowrance, Plaisant et al. (eBook)
VIDEOS
Editor of the HCIL Videos (1991-2006). Later videos are in the project pages.
Catherine Plaisant is a Research Scientist Emerita at the University of Maryland Institute for Advanced Computer Studies and a member of the Human-Computer Interaction Lab (HCIL). Catherine earned a Doctorat d’Ingénieur degree in France (similar to an Industrial Engineering PhD) and joined HCIL in 1988. She works with multidisciplinary teams on designing and evaluating new interface technologies that are useful and usable. In 2015 she was elected to the ACM SIGCHI Academy recognizing principal leaders in the field of Human-Computer Interaction. In 2018 she was awarded a five year INRIA International Chair, and in 2020 she received the IEEE VIS Career Award and the ACM SIGCHI Lifetime Service Award. Catherine Plaisant has published over 200 papers, on subjects as diverse as information visualization, medical informatics, universal access, decision making, digital humanities or technology for families. Her work spans the interface development lifecycle, with contributions to requirements gathering, interface design, and evaluation.
With long term collaborator Ben Shneiderman she co-authored the 4th, 5th and 6th Editions of Designing the User Interface, one of the major books on Human-Computer Interaction.
Need (a lot) more? Academic Resume (26 pages) or abbreviated version (7 pages – 2016) or TVCG Visualization Career Award Bio (1 page)
Projects (newer first)
PKclustering
This technique helps users create meaningful clusters in social networks. Users compare results of all available clustering algorithms in a mixed-initiative approach, and see how they match prior knowledge. This is a joint project with the INRIA AVIZ lab.
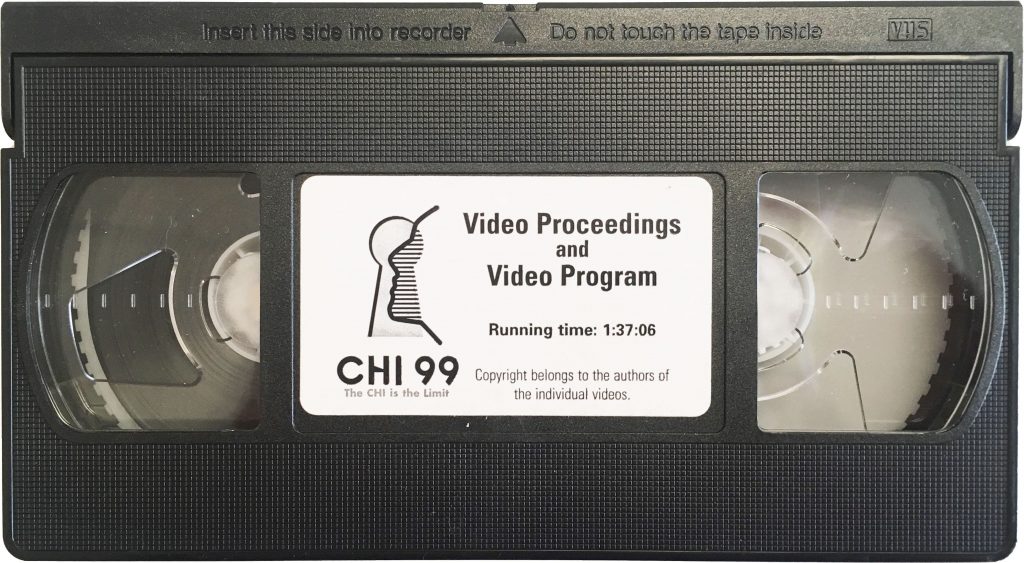
Historical CHI Video Project
From 1983 to 2002 the CHI Conference published a yearly Technical Video Program distributed on VHS videotapes. We are now working to preserve those video demonstrations and archive them in the ACM Digital Library.
PAOHVIS: Dynamic Hypergraphs Visualization
Parallel Aggregated Ordered Hypergraph (PAOH) is a novel technique to visualize dynamic hypergraphs (where links connect more than two nodes). Easy to learn it is well suited for medium size dynamic hypergraph networks such as those commonly generated by digital humanities projects. This is a joint project with the INRIA AVIZ lab.
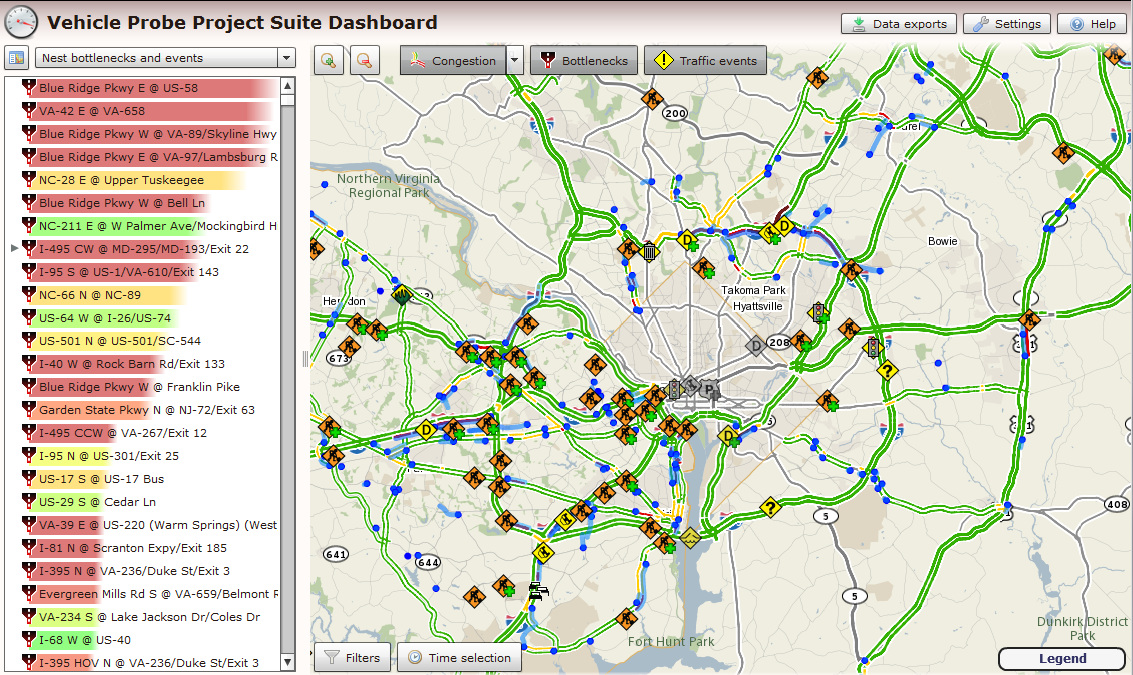
Visualization of transportation data: I helped the Center for Advanced Transportation Technology design or redesign the user interface of products for transportation managers and analysts. See RITIS (and also this much older HCIL transportation project)
PeerFinder explores the challenge of finding people like you, i.e. finding records similar to a seed record, based on record attributes AND event history. We know that users do not trust the advice of blackbox algorithms for important decision making, and we believe that transparency and user control can increase trust in recommendations that are based on people similarities.

EventAction introduces prescriptive analytics for temporal event sequences. The idea is to help users make plans based on data from similar people who achieve the desired outcome.
CoCo (short for COhort COmparison) helps analysts compare two groups of records such as patients records or student records to find differences in the event sequences found in the groups.

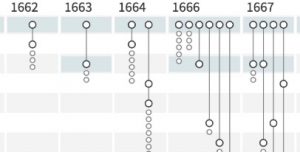
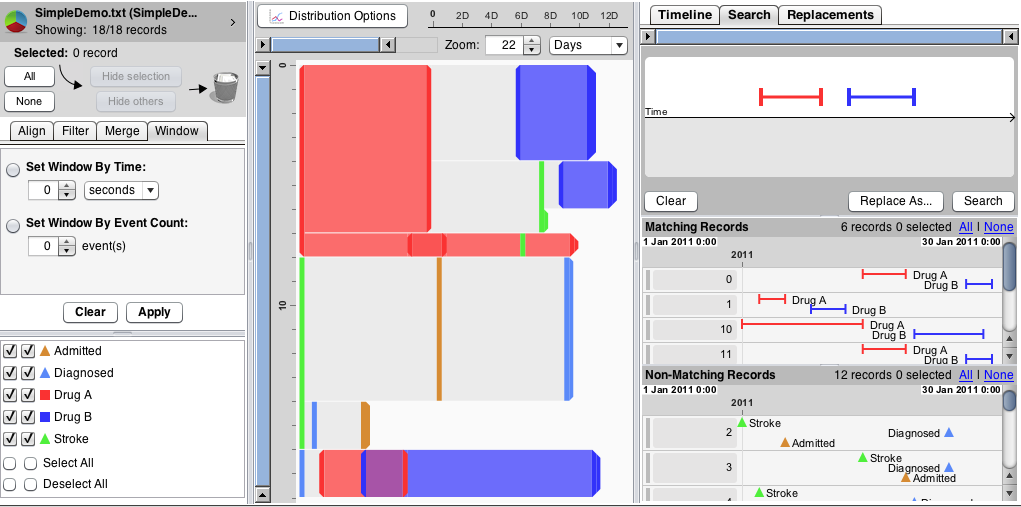
EventFlow for event analytics is now used by many researchers. EventFlow allows them to 1) search for specific patterns of events 2) see an overview of all sequences and 3) simplify the data to reveal useful patterns.
Precursor projects were:
LifeFlow, LifeLines2, Patternfinder and Patternfinder in Azyxxi
Twinlist: explored how visual layout and animation can help clinicians see similarities in drug lists and rapidly make decisions about which drugs to keep and which one to discontinue.
Related project: SHARP-C: Novel user interfaces for clinicians

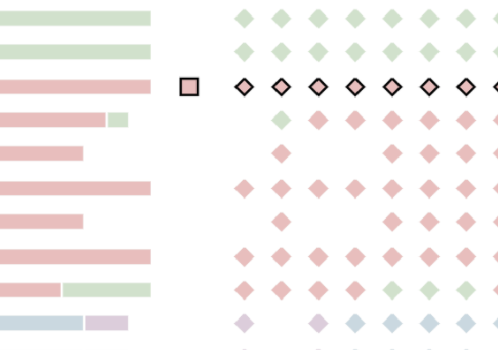
Treeversity visualizes changes over time of dynamic hierarchical data. Users can analyze relative and absolute change over a variable in each node, as well as created and removed nodes. They can also compare non inherently hierarchical datasets, by grouping them by attributes.

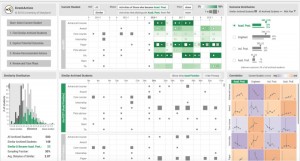
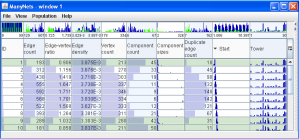
ManyNets: Looking at multiple networks or communities at once.
FeatureLens: we worked with literary scholars to and combined visualization and text mining to explore patterns of repetitions in text collections. This was part of the larger MONK project.

Visual Analytics Evaluation : The SEMVAST project helped develop benchmarks datasets and metrics for evaluation. I co-chaired the 1st IEEE Visual Analytics Challenge for several years starting with the 1st Challenge in 2006, and maintain the Visual Analytics Benchmark Repository.

iSonic : making georeferenced data accessible to users with visual impairments
Dynamic Queries, and Query Preview (an ancestor of faceted search)

LifeLines for Visualizing Medical Patient Records (and other personal histories)

Touchscreen Toggles (ON/OFF selection)
(see HCIL touchscreen research summary)
Made popular by the Apple vs Samsung “slide to unlock” patent war.
Networks
Trees and hierarchies
Others
TimeSearcher for exploration of time series.
MILC Studies, a method for evaluation of visualization and visual analytics prototypes
GOVSTAT: integration of Data and Interfaces to Enhance Human Understanding of Government Statistics:
Interliving: New Technologies for Families
A story telling robot for children in rehabilitation.
PhotoFinder: Personal Photo Libraries
Excentric Labeling for Information Visualization
User interfaces for highway traffic management
User Interfaces for the Library of Congress National Digital Library
User Interfaces for the Visible Human Project
(1992-93) Cancer Atlas: Dynamic Queries on a choropleth map [6:43 on the video]
High precision touchscreens, Information Kiosks, Home Automation (Summary)
Hypertext research (my first project at HCIL in 1987!)
Role Management as a guiding concept for the next generation of user interfaces