Taking a Magnifying Glass to Text
A new tool called TopicLens allows the user to move through of large volumes of text while controlling the level of detail for each theme.
By Deok Gun Park and Niklas Elmqvist
People routinely deal with large collections of documents, such as articles published in newspapers or online websites, collections of scientific papers in digital libraries, or press releases from Fortune 500 companies over an entire year. Large is a subjective term, but effectively means that the dataset contains so many documents that normal people cannot just read them all. To solve this challenge, we propose visual topic exploration technique called TopicLens. Our new tool shows all documents in the collection to the user as colored dots organized such that similar documents are close to each other. Users can then apply a magnifying lens on each cluster of documents, allowing them to see underlying topics in detail.
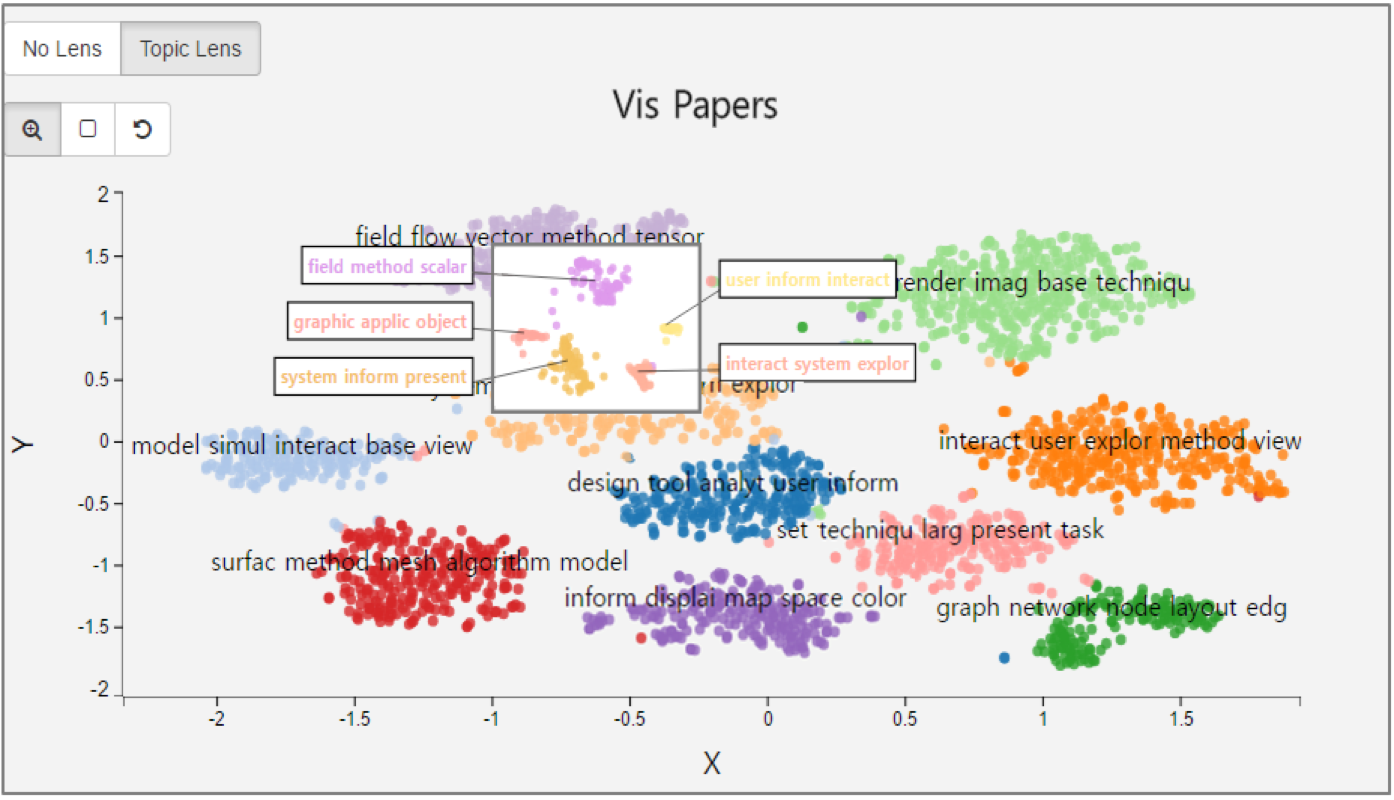
Figure 1. Screenshot of our document overview system integrated with TopicLens. The graph shows the clusters of papers that were published in an academic field with representative keywords are shown in the center of each topic cluster. When the user moves the TopicLens (shown as a small rectangle), the tool recomputes the topic model and layout in real-time on those documents captured within the lens, revealing their fine-grained topical structure and their visual overview. The representative keywords are visualized just outside of the lens pointing to the center of each topic cluster.
This technique is built upon a statistical text processing method called topic modeling, where the computer reads the text instead of the human and finds the themes, or topics, in the document collection. The computer then calculates how much each document belongs to each topic. The result is a small set of topics that summarizes the main themes in the document collection as well as a grouping of each document into the different themes. As a concrete example, let’s assume we are analyzing all the articles in a newspaper without knowing which sections these articles belong to. If Article 1 has words like ‘stock’, ‘price’, ‘market’ , then this article probably belongs in the financial section. Similarly, if Article 2 has ‘basketball’, ‘player’, ‘game’, it belongs to the sports section. Finally, if Article 3 has words like ‘game’,’price’, ‘market’, this may be a sports article about the football player market, or a finance article about the game industry. Topic modeling will find these themes and assign documents to them automatically, resulting in table like the one below. The bad news is that topic modeling will not tell what each topic is—instead, users have to deduce this for themselves based on the articles that belong this topic (in this case, topic 1 is finance and topic 2 is sports).
| Topic 1
(Finance-related) |
Topic 2
(Sports-related) |
|
| Article 1 | 0.90 | 0.10 |
| Article 2 | 0.10 | 0.90 |
| Article 3 | 0.55 | 0.45 |
Finding topics and associating documents to them is easy for three documents and two topics, but quickly becomes tricky when there are more than a thousand articles and many topics. Visualization, where interactive pictures are used to portray complex data, can help this problem. In the past, people have used visualizations for document collections where documents are positioned based on their similarity, often done using an approach called multi-dimensional scaling (MDS). The below picture shows one of most ambitious topic modeling visualization for all NIH funding for one year. .
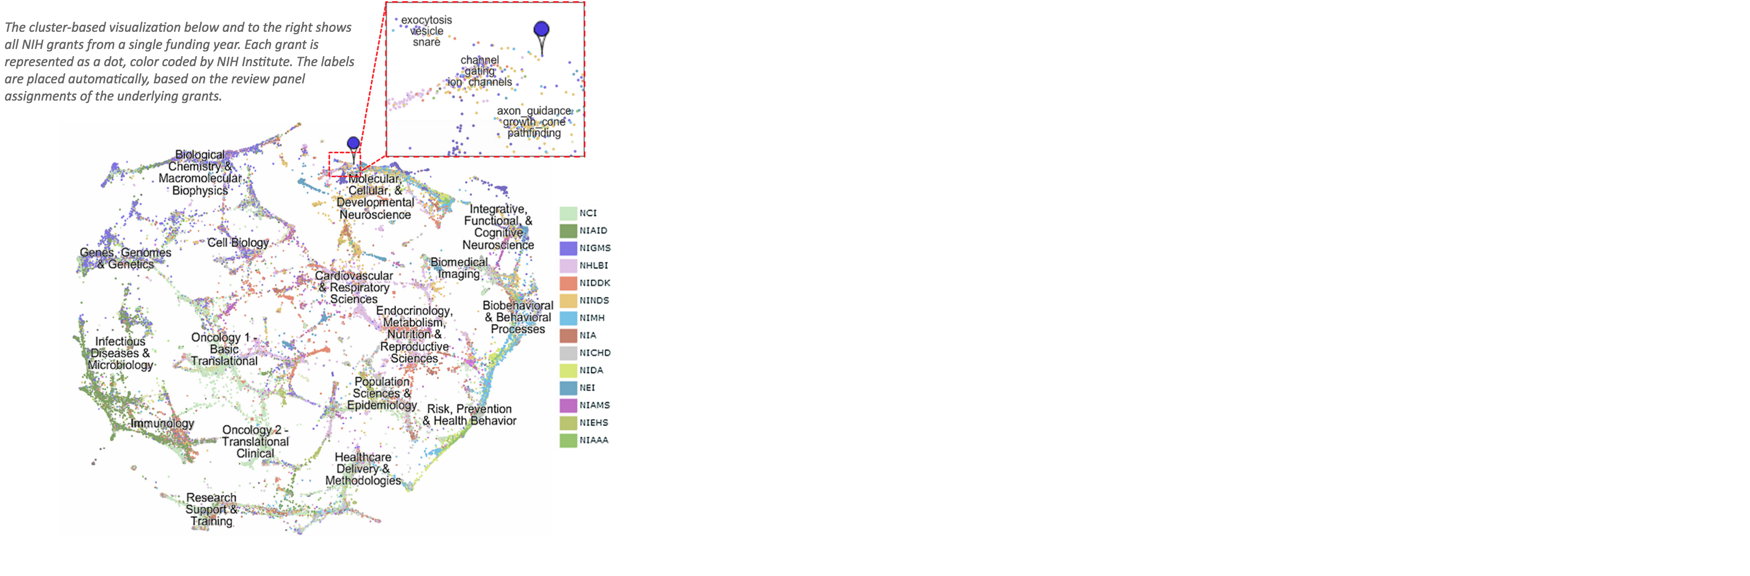
Figure 2. Topic map of all the 83,000 grants for one year awarded by the National Institutes of Health (NIH). Image from http://nihmaps.org/.
However, there is one problem with the above process: Topics often have a hierarchical nature. In the newspaper example, sections such as finance, politics, and sports can often be further categorized, such as sports being divided into baseball, football, and basketball, and each sport further divided into respective teams. In previous topic modeling approaches, users have to specify the number of topics, which is difficult without knowing details about the document collection. A more user-friendly way will allow the user to explore the documents and provide a magnifying glass to look at interesting regions in more detail while preserving the overview.
We propose to provide this “magnifying glass” using a new technique for visual topic exploration called ‘TopicLens’. When the user places the TopicLens over the region of interest in the document visualization in Figure 3, the lens will reveal how the regions under lens will be subdivided into further categories to provide more information about the topics of interests.
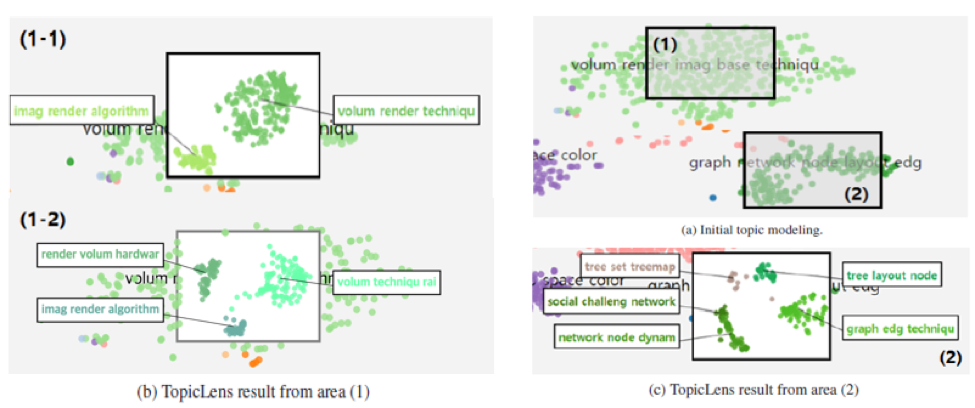
Figure 3. An Example of using TopicLens to see the underlying structure of document clusters.
The TopicLens technique was designed and developed by a team of researchers from Korea University in Seoul, South Korea, and University of Maryland in College Park, MD. Each partner institution provided the expertise for the key technical innovations necessary to make this technique possible. The first innovation is an approach to localized topic modeling. When the user selects documents using the lens, it performs a quick topic modeling given this documents. A second innovation is a semi-supervised 2D embedding where similar documents are placed near each other on the screen. The new embedding ensures that document markers are stable on the screen, avoiding the random placement used in prior algorithms. Finally, a third innovation is the novel lens interaction where users directly control the magnifying lens on documents they are interested in. The academic paper (here) provides more detail.
More Information
This paper is accepted for publication at the IEEE VAST conference. Here is the citation:
M. Kim; K. Kang; D. Park; J. Choo; N. Elmqvist, “TopicLens: Efficient Multi-Level Visual Topic Exploration of Large-Scale Document Collections,” in IEEE Transactions on Visualization and Computer Graphics , vol.PP, no.99, pp.1-1
Additional resources:
- Paper: http://ieeexplore.ieee.org/document/7539597/
- Video Demo: https://www.youtube.com/watch?v=RKC5w9dZmXQ
Visualization research at the HCIL has a long and proud history, going back to the founding of the lab in 1983. Today, visualization researchers at the HCIL conducts research in information visualization, visual analytics, and data science. Deok Gun Park is a Ph.D. student in Computer Science at University of Maryland, College Park and a member of the HCIL. Niklas Elmqvist is an associate professor of information studies at the University of Maryland, College Park and a member of the HCIL. This work is done in collaboration with Minjeong Kim, Kyeongpil Kang, and Jaegul Choo at Korea University in South Korea.