ARCHIVES – Videos
Last updated in 2012
In the early years of the HCIL (from 1991 to 2002), a videotape was produced every year by Catherine Plaisant for the annual Symposium. The majority of HCIL projects were represented in those videos. Many found their way into CHI Conference Video Programs.
After 2002, digital cameras and video editing tools made it easy for individual researchers to produce their own videos, and those videos can be found in the project pages. Some are listed here, but not all projects are represented here.

In addition, please consult the archive of the User Interface Strategies satellite broadcast videotapes from Ben Shneiderman. They include lectures and demonstrations HCIL work but also work from other leaders in the field of HCI.
HCIL Videos by year:
2012 2011 2010 2009 2008 2006 2005 2004 2003 2002 2001 2000 1999 1998 1997 1996 1995 1994 1993 1992 1991
2012
Ensuring Timely Management of Medical Orders (6:00)
Sureyya Tarkan, Catherine Plaisant, Ben Shneiderman
Primary care physicians order many tests from their patients. These patients go to outside facilities to get their orders processed. Results of such orders are sent back to the primary care physicians who have to handle incoming orders and follow-up with their patients. However, due to the complexity of the workflow, many errors and delays happen during this process, which is reported to cause harm on patients. As a result, laboratory test result management is the primary cause of malpractice litigation in the medical domain. This video shows our approach to solve the problem.
Rich Tabular Displays
Actions for Rapid Completion
Views for Different Roles
Table Design Guidelines
Retrospective Analysis Visualization in short
Related Project Page
Downloadable MP4
Promoting Timely Completion of Multi-Step Processes – A Visual Approach to Retrospective Analysis
Kostas Pantazos, Sureyya Tarkan, Catherine Plaisant, Ben Shneiderman
Multi-step processes are common in healthcare, software development, and other dynamic environments. Managers who monitor processes are overwhelmed by information, and often limited in the time to investigate data from different viewpoints. We propose a visual approach to facilitate retrospective analysis, to promote timely completion of multi-step processes, and improve performance. It uses a novel visualization called the Process Completion Diagram (PCD) that aggregates event-logs into in-time, late and not-completed completions, and visualizes those using shapes and colors. The interactive Multi-Step Process Visualization (MSPro- Vis) combines a number of PCDs and allows users to review and compare series of PCDs at three levels of detail, allowing comparisons between steps or between actors executing those steps. MSProVis computes default thresholds that define in-time and late completions. These might trigger alarms, and allow managers to adjust those thresholds interactively.
Related Project Page
Downloadable MP4
Exploring Point and Interval Event Patterns: Display Methods and Interactive Visual Query
Megan Monroe, Krist Wongsuphasawat, Catherine Plaisant, Ben Shneiderman, Jeff Millstein, Sigfried Gold
Our work on searching point-based event sequences with the Align, Rank, Filter, and Summary concepts produced a powerful tool (Lifelines2) that is being applied in an increasing set of medical and other applications. The LifeFlow aggregation tool expanded the capabilities of Lifelines2 to show common patterns of events on a single-screen display, resulting in the ability to summarize millions of individual patient records. However, users found that point-based event sequences limited their capacity to solve problems that had inherently interval attributes, for example, the 3-month interval during which patients took a medication. This paper reports on our development of EventFlow, an application that integrates interval-based events into the original LifeFlow mechanisms. Interval events represent a fundamental increase in complexity at every level of the application, from the input and data structure to the eventual questions that a user might ask of the data. Our goal was to accomplish this integration in a way that appeared to users as a simple and intuitive extension of the original LifeFlow tool. In this paper, we present novel solutions for displaying interval events, simplifying their visual impact, and incorporating them into meaningful queries.
Related Project Page
Vimeo
Identifying and Measuring Assocations of Temporal Events
Hsueh-Chien Cheng, Catherine Plaisant, Ben Shneiderman
Large databases of temporal records have made it possible for researchers to verify their hypotheses related to temporal event sequences. However, with the overwhelming size of data and numerous possible patterns, an important issue is what patterns should be highlighted and presented to users. We implement a visualization tool, PairFinder, to enable users to efficiently locate patterns of interest. Users can 1) see all the results of the potential event patterns and 2) use interestingness measures to rank event patterns by their interestingness. In addition, users can hide irrelevant patterns and filter records by record attributes. By looking only at the top ranked patterns, users can easily scan large number of patterns. We demonstrate the potential of PairFinder with four case studies and summarize the patterns found in the data sets.
Related Project Page
Downloadable MP4
2011
Action Science Explorer Demonstration
Cody Dunne, Robert Gove, Ben Shneiderman, Bonnie Dorr, and Judith Klavans
The goal of iOpener (Information Organization for PENning Expositions on Research) is to generate readily-consumable surveys of different scientific domains and topics, targeted to different audiences and levels. We’ve created an infrastructure for automatic summarization of research domains that links bibliometric lexical link mining, summarization techniques, and visualization tools. Part of this is the Action Science Explorer, a new tool which presents the academic literature for a field using many different modalities: lists of articles, their full texts, automatic textual summaries, and visualizations of the structure of the citation network.
Related Project Page
LifeFlow
Krist Wongsuphasawat, John Alexis Guerra Gomez, Catherine Plaisant, and Ben Shneiderman
Event sequence analysis is an important task in many domains: medical researchers study the patterns of transfers within the hospital for quality control; transportation experts study accident response logs to identify best practices. In most cases they deal with more than thousands of records. While previous research has focused on searching and browsing, overview tasks are often overlooked. We introduce a novel interactive visual overview of event sequences called LifeFlow. LifeFlow scales to any number of records, summarizes all possible sequences, and highlights the temporal spacing of the events within sequences.
Creating LifeFlow | Downloadable Zipped MP4 (2 MB)
Step-by-step intro to LifeFlow | Downloadable Zipped MP4 (28 MB)
Short video presented at CHI2011 | Downloadable Zipped MP4 (12 MB)
Basic LifeFlow feature demo | Downloadable Zipped MP4 (101 MB)
LifeFlow grouping by attributes and ranking features demo | Downloadable Zipped MP4 (3 MB)
Related Project Page
2010
ManyNews Demonstration (5:54)
Manuel Freire and Catherine Plaisant
ManyNets is a network visualization tool with tabular interface designed to visualize up to several thousand network overviews at once. This allows networks to be compared, and large networks to be explored using a divide-and-conquer approach. For example, comparing different social networks can provide insights into the underlying causes for their differences. Or an individual social network can also be subdivided into temporal slices, which can then be examined to locate temporal patterns or regions and periods change. Networks can also be subdivided and compared based on motifs (small patterns of connectivity), clusters, or network-specific attributes.
Related Project Page
2009
Community Health Maps (3:01)
Awalin Sopan, Angela Noh, Paul Rosenfeld, Ginnah Lee, and Sohit Karol
The Department of Health and Human Services keeps track of a variety of health care indicators across the country, resulting in a large geospatially multivariate data set. Community Health Map is a web application tha t enables users to visualize health care data in multivariate space as well as geospatially. It is designed to aid exploration of this huge data repository and deliver deep insights for policy makers, journalists, and academic researchers.
2008
HCIL 25th Anniversary Video (5:16)
Ben Bederson, Allison Druin, Catherine Plaisant, Ben Shneiderman
HCIL members Ben Bederson, Allison Druin, Catherine Plaisant, Ben Shneiderman discuss the Lab’s history in celebration of its 25th anniversary.
SocialAction: Analyzing the Social Network of US Senators (1:54)
Adam Perer, Ben Shneiderman
This video shows the patterns of voting among 100 U.S. Senators during 2007. The Republican and Democratic Senators are shown to be very distinctive in their voting patterns, with only three Republican Senators crossing over to vote frequently with Democrats. Party cohesion is stronger for Democrats than Republicans. Video created by Adam Perer using SocialAction.
Related Project Page
Vimeo
Lifelines2 (4:58)
Taowei David Wang, Catherine Plaisant, Ben Shneiderman
This demonstration shows how to use the main features of Lifelines2 to find patients who experience reduced renal function as a result of adverse radiology contrast procedures.
Related Project Page
2006
Categorized Overview of Web Search Results
Bill Kules and Ben Shneiderman
Categorized overviews of search results enable informative forms of interaction to support exploratory search. Meaningful and stable categories help searchers explore and understand large result sets. Search engines are effective at generating long lists of search results. But the lack of overviews prevents searchers from effectively organizing and exploring their results. Categorizing search results using meaningful and stable classifications helps exploratory searchers, who have vague or evolving information needs, and searchers who lack detailed knowledge about the subject of their search.
Related Project
Downloadable MPG (18 MB)
Network Visualization by Semantic Substrates
Ben Shneiderman and Aleks Aris
NVSS 1.0 (Network Visualization by Semantic Substrates) enables users to specify regions to place nodes, and then control over link visibility.
Related Project Page
Downloadable MPG (17 MB)
Balancing Systematic and Flexible Exploration of Social Networks
Adam Perer and Ben Shneiderman
Social Action is a social network analysis tool that integrates visualization and statistics to improve the analytical process. Social network analysis (SNA) has emerged as a powerful method for understanding the importance of relationships in networks. However, interactive exploration of networks is currently challenging because: (1) it is difficult to find patterns and comprehend the structure of networks with many nodes and links, and (2) current systems are often a medley of statistical methods and overwhelming visual output which leaves many analysts uncertain about how to explore in an orderly manner. Although both statistical methods and visualizations have been used by network analysts, exploratory data analysis remains a challenge. We propose that a smooth integration of these technologies in an interactive exploratory tool, SocialAction, could dramatically speed insight development.
Related Project Page
Downloadable MPG (33 MB)
NetLens: Iterative Exploration of Content-Actor Network Data
Hyunmo Kang, Catherine Plaisant, Bongshin Lee, Benjamin B. Bederson
Most visualization research on understanding relationships in large datasets implicitly assumes that a node link diagram is appropriate. However, we believe that while node-link diagrams have their place, they don’t scale up well and too often produce cluttered overviews with few readable labels, and often have difficulties supporting even the simplest tasks such as reviewing the papers that cite a selected paper. In this research, we took a completely different approach in designing NetLens by using multiple simple coordinated views of ordered lists and histogram overviews to represent a Content-Actor model of information. Examples of Content-Actor pairs of interest to the visual analytics community include scientific publications and authors, emails and people, legal cases and courts, intelligence reports and countries, etc. In all those examples, both the content and actors consist of networked data such as reports citing other reports, authors having advisors or co-authors. NetLens shows paired networks of content and actors in coordinated views and allows users to refine their queries by transferring filtered data in one entity window to the other iteratively.
Related Project Page
Downloadable MPG (55 MB)
ModelCraft:Capturing Freehand Annotations and Edits on Physical Models
Hyungyoung Song, Francois Guimbretiere, and Chang Hu
With the availability of affordable new desktop fabrication techniques such as 3D printing and laser cutting, physical models are used increasingly often during the architectural and industrial design cycle. Models can easily be annotated to capture comments, edits and other forms of feedback. Unfortunately, these annotations remain in the physical world and cannot be easily transferred back to the digital world. Here we present a simple solution to this problem based on a tracking pattern printed on the surface of each model. Our solution is inexpensive, requires no tracking infrastructure or per object calibration, and can be used in the field without a computer nearby. It lets users not only capture annotations, but also edit the model using a simple yet versatile command system. Once captured, annotations and edits are merged into the original CAD models. There they can be easily edited or further refined. We present the design of a SolidWorks plug-in implementing this concept, and report initial feedback from potential users using our prototype. We also present how this prototype could be extended seamlessly to a fully functional system using current 3D printing technology.
Related Project Page
Downloadable MPG (46 MB)
A Pen-top Interface for Interactive Paper
Chunyuan Liao and Francois Guimbretiere
The Pen-top Interface for Interactive Paper use visual, tactile, and auditory feedback in real time to enhance paper-based interfaces.
Downloadable MPG (39 MB)
RouteLens
Aaron Clamage, Ben Bederson, and Catherine Plaisant
RouteLens is a tool to help users select the best route for their common trips based on their personal driving history. Each time an individual drives along a route, the system records the history of their trip. Once they have driven a sufficient number of trips, they will be able to see trends in travel time, stop frequency, number of stops, total stopped time and speed.
Related Project Page
Downloadable MPG (73 MB)
Exploring Erotics in Emily Dickinson’s Correspondence
Catherine Plaisant, James Rose, Bei Yu, Loretta Auvil, Matthew G. Kirschenbaum, Martha Neil Smith, Tanya Clement, and Greg Lord
This video presents a user interface and web architecture that integrates text mining, a graphical user infterface and visualization, while attempting to remain easy to use by non specialists. Users can interactively read and rate documents found in a digital libraries collection, prepare training sets, review results of classification algorithms and explore possible indicators and explanations.
Downloadable MPG (54 MB)
2005
Exploring Web Search Results
Bill Kules and Ben Shneiderman
Downloadable MPG (41 MB)
ICDL Continuing to Grow
Downloadable MPG (70 MB)
InterSon
Downloadable MPG (58 MB)
Launch Title & AppLens
Downloadable MPG (21 MB)
Meaningful Photo Layouts
Downloadable MPG (23 MB)
PapierCraft
Downloadable MPG (46 MB)
Scriboly
Downloadable MPG (42 MB)
TimeSearcher 2
Downloadable MPG (60 MB)
Computer Rage
Downloadable MPG (29 MB)
2004
NoteLens
Downloadable MPG (56 MB)
ProofRite
Downloadable MPG (50 MB)
What Children have Taught Us
Downloadable MPG (69 MB)
Cross Y
Downloadable MPG (49 MB)
2003
TreeJuxtaposer
Downloadable MPG (50 MB)
Making of the International Children’s Digital Library
Downloadable MPG (58 MB)
Stories with Physical Programming
Downloadable MPG (74 MB)
Help Interfaces
Downloadable MPG (61 MB)
Hierarchical Clustering Explorations
Downloadable MPG (85 MB)
MediaFinger
Treemap 4
Downloadable MPG (130 MB)
2002
Introduction (1:10)
Ben Bederson
Downloadable MPG
Designing the Classroom of the Future – 2001:2002 (3:53)
Druin, A., Liao, S., Chipman, G., Farber, A., Julian, D. and the staff and students of the University of Maryland’s Center for Young Children
We describe the activities of the second year of our 5-year research project to create the Kindergarten Classroom of the Future. This work is a partnership between researchers at the HCIL and children and teachers at the Center for Young Children on the campus of the University of Maryland. The culmination of this partnership was the development of a “Magic Wall” which enables young children to simultaneously draw on a touch surface. With this technology, two children holding their “magic keys” in one hand can finger paint together simultaneously. We describe our design methods and the lessons learned.
Downloadable MPG (52 MB)
International Digital Library for Children (1:53)
Druin, A., Bederson, B., Hourcade, J-P, Rose, A., Farber, A., Liao, S., Revelle, G., Campbell, D., Kahle, B., Kruskal, A., Lal, A., Mattews, J., Rhodes, E., White, C., Ochs, S., Berke E., Cossans, C.
Our team at the University of Maryland continues to partner with children, educators, and diverse researchers to develop interface technologies for children’s digital libraries. This video presents the team’s design activities and technology directions for the future. By leveraging Maryland’s previous NSF-supported research, we expect to move beyond a small-scale demonstration project to a large-scale deployment of new user interface technologies for children’s searching, browsing, reading and sharing.
Downloadable MPG (25 MB)
FishCal: A Calendar Interface for PDAs (5:50)
Ben Bederson
FishCal is a novel calendar interface for PDAs. It supports users in performing planning and analysis tasks by using a fisheye representation of dates coupled with compact overviews, user control over the visible time period, and integrated search. Users can see overviews, easily navigate the calendar structure, and discover patterns and outliers. FishCal was compared to Microsoft’s Pocket PC 2002T calendar. Eleven users performed complex tasks significantly faster and completed them more often with FishCal. Task by task user satisfaction data showed a significant advantage for FishCal as well.
Downloadable MPG (75 MB)
SpaceTree: a Novel Node-Link Tree Browser (4:00)
Grosjean, J., Plaisant, C., Bederson, B.
SpaceTree is a novel tree browser that builds on conventional node link tree diagrams. It adds dynamic rescaling of branches to best fit the available screen space, optimizes camera movement, and uses preview icons to summarize the topology of the branches that cannot be expanded. It includes integrated search and filter functions. SpaceTree is demonstrated using an organization chart. A controlled experiment compared it to the hyperbolic tree browser and Microsoft Explorer.
Downloadable MPG (52 MB)
Interactive Information Visualization of a Million Items (6:32)
Fekete, J. D.
What are the limits of information visualization? How many items can we see and understand before we need to aggregate? To answer these questions, we have designed a set of techniques to push current visualization techniques to their limits. By using on the shelves accelerated graphics cards, special graphics and programming techniques, we can display about one million items on a regular 1600 by 1200 pixels screen with interactive feedback.
Downloadable MPG (82 MB)
An Interactive Message Board as a Technology Probe for Family Communication and Coordination (5:54)
Hutchinson, H.
Our family message board connects households from distributed families with a familiar interface of electronic Post-It notes on a writable LCD screen. As part of the InterLiving project, we are working with 7 multi-generational families in Sweden, France and the US as design partners. We are using traditional ethnographic and participatory design methods such as low-tech prototyping in addition to “technology probes,” such as the message board, to explore the communication and coordination needs of distributed families. Technology probes are simple but interesting technologies that act as catalysts for design ideas. Our family design partners have used them for a period of time in their homes and are now working with researchers to study how and why they were used and designing new technologies based on their findings.
Downloadable MPG (25 MB)
Searching Foreign-Language Collections (3:36)
Oard, D., Nossal, M.
Finding information in a language that the searcher cannot read is a challenging task that is increasing in importance with the growing diversity of languages on the World Wide Web. Our first goal is to support the formulation of effective queries in languages that users may not know. We provide minimally intrusive translation assistance, allowing searcher and system to interact in a way that produces a more effective query than either could alone. Our second goal is to help users recognize the most useful documents found by the system, even if no infrastructure exists for sophisticated machine translation, in which case we use a simple translation based on word and phrase replacement, augmented with an interface that guide the searcher’s attention to terms that are likely to be helpful for deciding on the utility of documents.
Downloadable MPG (46 MB)
Leonardo’s Laptop: Human Needs and the New Computing Technologies (6:31)
Ben Shneiderman
The old computing was about what computers could do; the new computing is about what users can do. Attention is shifting from making computers intelligent to making users creative. Leonardo da Vinci could help as an inspirational muse for the new computing to push for improved quality through scientific study and more elegant design through visual thinking. The first goal is to reduce the high level of user frustration. Then the new computing principle is that human needs should shape technology. Four circles of human relationships and four human activities map out the human needs for mobility, ubiquity, creativity, and community. Million-person communities will be universally usable through desktop, palmtop and fingertip devices that support e-learning, e-business, e-healthcare, and e-government (www.cs.umd.edu/hcil/newcomputing).
Downloadable MPG (88 MB)
Washington Post Interview (2:52)
Video from John Poole, Washingtonpost.com
Interview of Ben Shneiderman, Allison Druin and Ben Bederson from www.washingtonpost.com, as part of a story on Human-Computer Interaction, Thursday, May 9, 2002
Downloadable WMV (3 MB)
2001
Introduction (2:15)
Ben Bederson
Welcome and short tour of the HCIL facilities.
Downloadable MP4 (6 MB)
PhotoFinder Goes Public: Redesigning for the CHI Community (3:55)
Ben Shneiderman, Hyunmo Kang, Bill Kules, Catherine Plaisant
The PhotoFinder kiosk version with network support and group annotation was installed at the CHI 2001 Conference in Seattle. We showed 3300 photos from 65 events on a network of 7 machines. Users were very enthusiastic, making comments like “Great! Thanks for the memories!” and “This is addictive.” CHI pioneers and newcomers spent hours browsing and annotating, returning to bring their friends. Visitors added 1000 name annotations plus 400 captions, and attendees brought us 1200 new photos. We present the design features and videotapes of users at the conference.
Related Project Page
Downloadable MP4 (11 MB)
PhotoMesa: A Zoomable Image Browser (4:00)
Benjamin B. Bederson
PhotoMesa is an image browser with an easy-to-use interface designed for family use. It allows users to see many directories of images at once, and uses zooming to navigate through the images, providing a simple way of getting an overview or detailed information.
Related Project Page
Visual Specification of Queries for Finding Patterns in Time-Series Data (2:50)
Harry Hochheiser and Ben Shneiderman
Widespread interest in discovering features and trends in time series has generated a need for tools that support interactive exploration. TimeFinder provides graphical, direct manipulation facilities for interactive formulation and modification of queries over time series data. Used in combination with TimeFinder’s overview envelope display, these tools support data exploration and guide data mining efforts.
Related Project Page
Downloadable MPG (7 MB)
Fisheye Menus (3:30)
Benjamin B. Bederson
“Fisheye menus” apply traditional fisheye graphical visualization techniques to linear menus, which provides for an efficient mechanism to select items from long menus. Fisheye menus dynamically change the size of menu items to provide a focus area around the mouse pointer. This makes it possible to present the entire menu on a single screen without requiring buttons, scrollbars, or hierarchies.
Related Project Page
Downloadable MPG (9 MB)
Visualization for Production Management: Treemap and Fisheye Table Browser (5:10)
Catherine Plaisant, Ketan Babaria, Ben Bederson, Steve Betten, Jim Blowitski, Jesse Grosjean, Ben Shneiderman
Using the example of oil production we show how information visualization can be used for the periodic monitoring of production equipment. Here we use a Treemap with dynamic queries to provide a compact visual overview of all items. Users can spot at a glance the items that are not functioning normally. They can click on individual items and view the history of all their parameter values using a fisheye table browser. We discuss the benefits of alternative displays and layouts.
Related Project Page
Downloadable MPG (14 MB)
Generalizing Query Previews (3:50)
Egemen Tanin, Catherine Plaisant, Ben Shneiderman
Companies, government agencies, and other organizations are making large tables of data available over the Internet. The common form fill-in interfaces often lead to zero-hit or mega-hit queries. To alleviate this problem Generalized Query Previews supply distribution information on attributes of interest selected by the user, providing an overview of the data. As a query is being formed, continuous feedback is given about the size of the results.
Downloadable MP4 (7 MB)
SearchKids: A Digital Library for Children (6:00)
Sherman, A. Farber, A. Druin, J. Best, C. Cosans, J. Hammer, A. Kruskal, A. Lal, J. Matthews, E. Rhodes, T. Schwenn, B. Bederson, D. Campbell, J. P. Horcade, S. Ochs, C. O’Neil, C. Rahmani, G. Revelle, B.Weinstein, S. Martin, J. Floyd, K. Horvath and E. Row
An interdisciplinary, intergenerational team developed SearchKids, a zoomable digital library that contains multimedia information about animals. Our digital library supports collaboration by enabling several children to navigate the same information on the same computer at the same time. The design process as well as the technology is presented.
Related Project Page
Downloadable MP4 (15 MB)
From MusicBlocks to AnimalBlocks: a case study in design (5:20)
Allison Druin, Lisa Sherman, Sante Simms, John Sosoka, Dave Galvan, Ben Bederson, Allison Farber, Jaime Montemayor, Glenda Revelle, Jack Best, Cassandra Cosans, Joe Hammer, Alex Kruskal, Abby Lal, Jade Matthews, Emily Rhodes, Thomas Schwenn
MusicBlocks is an award-winning toy, which enables children ages 2 and older to explore music by using electronic blocks. In the summer of 2000 our intergenerational design team of adults and children began a partnership with Neurosmith, the creators of MusicBlocks. Together we designed AnimalBlocks, a new version of MusicBlocks. This video demonstrates MusicBlocks and the design process we used to create AnimalBlocks.
Related Project Page
Downloadable MPG (13 MB)
Designing the Classroom of the Future (6:50)
Allison Druin, Jessica Porteous, Gene Chipman, Allison Farber, the staff and students of the University of Maryland’s Center for Young Children and Yorktown Elementary School
We describe the first year of our 5-year research project to create the Kindergarten Classroom of the Future in collaboration with the Center for Young Children on the campus of the University of Maryland and Yorktown Elementary School in Bowie, MD. We present a “computer garden” for teachers and students to use new collaborative technologies. We show how our technology design team at work and summarize lessons learned.
Related Project Page
Downloadable MP4 (16 MB)
Jesterbot: a Storytelling Robot for Pediatric Rehabilitation (4:20)
Catherine Plaisant, Cori Lathan, Allison Druin, Max Vice, Kris Edwards, Jaime Montemayor, Lisa Sherman
Working with children as design partners we developed Jesterbot, a storytelling robot for use with children in rehabilitation. Children remotely control a soft robot by using a variety of body sensors adapted to their disability or rehabilitation goal. The robot’s actions can be recorded along with the child voice to create stories. This project is a joint venture with AnthroTronix, Inc.
Related Project Page
Downloadable MPG (12 MB)
2000
Browsing and annotating digital photographs with Photofinder (2:45)
H. Kang, B. Shneiderman, Plaisant, C.
Software tools for personal photo collection management are proliferating, but they usually have limited searching and browsing functions. PhotoFinder enable non-technical users of personal photo collections to search and browse easily. Direct annotation allows users to drag labels such as personal names and drop them on a photo.
Related Project Page
Downloadable MPG (55 MB)
Learning histories in simulation based learning environments (1:55)
C. Plaisant, A. Rose, R. Salter, B. Shneiderman, G. Rubloff
A simulation-based learning module on a vacuum pump system is demonstrated. The learning historian allows users to record their actions and replay them to review what they did. A visual history maps actions with outcomes. Histories can be saved and mailed to peer and instructors.
Related Project
Downloadable MPG (24 MB)
Dynamap: Dynamic queries on choropleth maps (2:00)
G. Dang, C. North
Dynamaps allows the rapid exploration of large Census data tables. It shows a zoomable map of the US, color coded by one of the one attributes. A slider is available for each attribute and allows users to filter states or counties using dynamic query techniques. New software and GIS tools now make it easy to develop such applications.
Related Project Page
Related Research Summary
Downloadable MPG (24 MB)
StoryRooms (3:50)
Druin, Alborzi, Boltman, Hendler, Montemayor, Platner, Sherman, Best, Hammer, Kruskal, Lal, Schwenn, Sumida, Wagner
StoryRooms are room-sized immersive storytelling experiences for children. With the use of low-tech and high-tech storytelling elements, children can author physical storytelling experiences to share with other children. We describe how a StoryRoom can be created by kids and show an example StoryRoom being used.
Related Project Page
Downloadable MPG (50 MB)
1999-1991 HCIL Video Retrospective
About this retrospective: It was a challenge to select the segments to be included in this retrospective. We tried to include the most important work having a strong visual component (e.g. dynamic queries, treemaps, zooming interfaces), as well as pieces which we know are appreciated for teaching HCI (e.g. the schedulers, toggles). We favored recent work and short pieces.
Snap together visualization (4:31)
C. North, B. Shneiderman
Information visualizations with multiple coordinated views enable users to rapidly explore complex data and discover relationships. However, it is usually difficult for users to find or create the coordinated set of visualizations they need. Snap-Together Visualization allows users to coordinate visualizations to create customized multiple-view interfaces. Users query their relational database and load results into desired visualizations. Then they specify coordinations between visualizations for selecting, navigating, or re-querying. Developers can make independent visualization tools “snap-able” by including a few simple hooks.
Related Project Page
Downloadable MPG (63 MB)
Designing PETS: A Personal Electronic Teller of Stories (7:49)
A. Druin, J. Montemayor, J. Hendler, B. McAlister, A. Boltman, E. Fiterman, A. Plaisant, A. Kruskal, H. Olsen, I. Revett, T. Plaisant Schwenn, L. Sumida, R. Wagner
In today’s homes and schools, children are emerging as frequent and experienced users of technology. As this trend continues, it becomes increasingly important to ask if we are fulfilling the technology needs of our children. To answer this question, we have developed a research approach that enables young children to have a voice throughout the technology development process. This video describes our research approach with a team of six children (ages 7-11 years old) and six adult researchers with experience in computer science, education, art, and robotics. In this video, we show our team at work to develop PETS: A Personal Electronic Teller of Stories. This is a new robotic pet that can support children in the storytelling process.
Related Project Page
Downloadable MPG (105 MB)
KidPad: A Collaborative Storytelling Environment for Children (3:11)
B. Bederson, A. Druin, J-Pablo Hourcade, A. Boltman
Narratives are ubiquitous. Some argue that the fundamental element in life is the story and storytelling can be viewed as a framework for almost all communication. As such, storytelling can also be used as an approach to learning. Within our recently launched KidStory research project (in a collaboration with the European Union), storytelling is the focus for a set of tools and collaboration principles that we are developing. The technology tools we have come to see as important support co-present collaboration for children. This technique we call Single Display Groupware, where children can work together at the same computer as partners in creating a shared story. Our goal is to develop tools that will enhance children’s communication skills, expressive storytelling capabilities, and collaboration experiences.
Related Project Page
Downloadable MPG (42 MB)
Query Previews in Networked Information Systems – The case of EOSDIS (1999 update) (7:02)
C. Plaisant and M. Venkatraman
Query Previews allow users to rapidly gain an understanding of the content and scope of a digital data collection. These previews present overviews of abstracted metadata enabling users to rapidly and dynamically avoid undesired data. This video summarizes our work on developing query previews for NASA Earth Science data. New developments include approaches that successfully address the challenge of multi-valued attribute data. Memory requirements and processing time associated with running these new solutions remain independent of the number of records in the dataset.
Related Project Page
Downloadable MPG (60 MB)
LifeLines: Enhancing Navigation and Analysis of Patient Records (7:41)
C. Plaisant, J. Li, D. Heller, B. Shneiderman
Using the familiar metaphor of timelines, LifeLines takes advantage of our ability to visually analyze information-abundant displays, and facilitates access to the details in the medical patient record. A Java user interface presents a one-screen overview. Problems, diagnoses, test results, or medications can be represented as dots or horizontal lines. Zooming provides more details; line color and thickness illustrate relationships or significance. The visual display acts as a giant menu, giving direct access to the details.
Related Project Page Downloadable MPG (103 MB)
Pad++: A Zooming User Interface (3:25)
Ben Bederson
This video demonstrates Pad++, a zooming user unterface (ZUI) designed for interactive graphical data creation and browsing. It takes the spatial metaphor standard from the computer window desktop interface one step further by incorporating the concept of scale. Pad++ is a two-dimensional surface that acts like a sketchpad, but is orders of magnitude larger in extent and resolution. This allows information to be created not only at any location, but at any size as well.
Related Project Page
Downloadable MPG (41 MB)
SimPLE: Simulated Processes in a Learning Environment (4:20)
Anne Rose
We have developed an application framework for creating simulation-based learning environments. We call it SimPLE. These environments use dynamic simulations and visualizations to represent realistic, time-dependent behavior; and are coupled with guidance material and other software aids that facilitate the learning process. The Software architecture enables independent contributions of both educational content (e.g., simulation models, guidance materials) and cognitive user environments such as user interface and software
Related Project Page
Downloadable MPG (52 MB)
Understanding the effect of incidents on transportation delays with a simulation based environment (4:28)
C. Plaisant, S. Keswani, P. Tarnoff
A simulation-based learning environment provide system designers and operators with an appreciation of the impact of incidents on traffic delay. We used SimPLE (Simulated Processes in a Learning Environment) which uses dynamic simulations and visualizations to represent realistic time-dependent behavior. Guidance material and other software aids facilitate learning. The simulation allows learners to close freeway lanes and divert traffic to an arterial road. Users can see the effect of the detour on freeway and arterial delay. Users can then adjust signal timing interactively on a time space diagram and watch the effect of their adjustment on green band changes and on arterial delays and total delays.
Related Project Page
Downloadable MPG (60 MB)
Bringing treasures to the surface: Previews and overviews in a prototype for the Library of Congress National Digital Library (7:30)
C. Plaisant, A. Komlodi, G. Marchionini, A. Shirinian, D. Nation, S. Karasik, T. Cronnell, and B. Shneiderman
We worked with a team from the Library of Congress (LC) to develop interface design components for LC’s American Memory collections of historical multimdeia materials. Our prototype illustrates the benefits of previews (such as samples, collections of thumbnails, and video previews) and overviews (such as timelines and automaticaly generated tables of contents) to facilitate the browsing of search results or entire collections.
Related Project Page
Downloadable MPG (104 MB)
Elastic Windows (5:00)
B. Shneiderman and E. Kandogan
Current WWW browsers are still primitive in that they do not support many of the user’s navigational needs. We propose a new browsing interface based on the Elastic Windows approach with hierarchical windows and multiple window operations. It provides a flexible organization where users can quickly organize and restructure the pages on the screen as they reformulate their goals.
Related Project Page
Downloadable MPG (67 MB)
Browsing Anatomical Image Databases : the Visible Human (XX)
F. Korn, C. North
The National Library of Medicine is preparing an archive consisting of anatomical images of a male and a female subject, including MRI, CT and cryosection images. This collection of images will be available to a large community of users with varying backgrounds and expertise. We are exploring visual metaphors for browsing and querying anatomy databases. Our first prototypes include novel overview techniques for rapid exploration of volumetric data, and for browsing medical concepts and anatomical terms.
Related Project Page
Downloadable MPG (81 MB)
WinSurfer: Treemaps for Replacing the Windows File Manager
M. Teittinen
WinSurfer is a directory maintenance tool running in MS Windows and using treemaps. Treemaps are a novel method for displaying hierarchical information using a 2-D space filling algorithm that partitions a rectangular region. WinSurfer lets you gracefully and rapidly examine your directory and invoke file actions.
Related Research Summary Downloadable MPG (76 MB)
Visual information seeking using the FilmFinder (6:12)
C. Ahlberg, B. Shneiderman
FilmFinder allows users to explore a large film database. By applying the dynamic queries approach to filtering information, a continuous starfield display of the films, and tight coupling among the components of the display, the FilmFinder environment encourages incremental and exploratory search.
Related Research Summary
Downloadable MPG (113 MB)
Dynamic queries demos: revised HomeFinder and text version plus health statistics atlas
Part 1 (3:29) | Part 2 (6:11)
B. Shneiderman
Because of the great interest in Dynamic Queries we are making these video demos available for instructional and training purposes. We appreciate the cooperation of the University of Maryland Instructional Television, which produced the original 5-hour User Interface Strategies ’94 program. Dynamic Queries are user controlled displays of visual or textual information. Ben Shneiderman presents the HomeFinder (developed by Chris Williamson), followed by the text version (Vinit Jain) and the Health Statistics Atlas (Catherine Plaisant and Vinit Jain).
Related Research Summary
Downloadable MPG: Part 1 (41 MB) | Part 2 (83 MB)
Filter-Flow metaphor for boolean queries (6:35)
D. Young, B. Shneiderman
Evidence shows that users of database or information systems have difficulties specifying complex boolean queries. We present a novel visual presentation based on water filter-flow metaphors that reveals the effect of selectors and operators (AND, OR and NOT) on query outcome.
Related Paper
Downloadable MPG (89 MB)
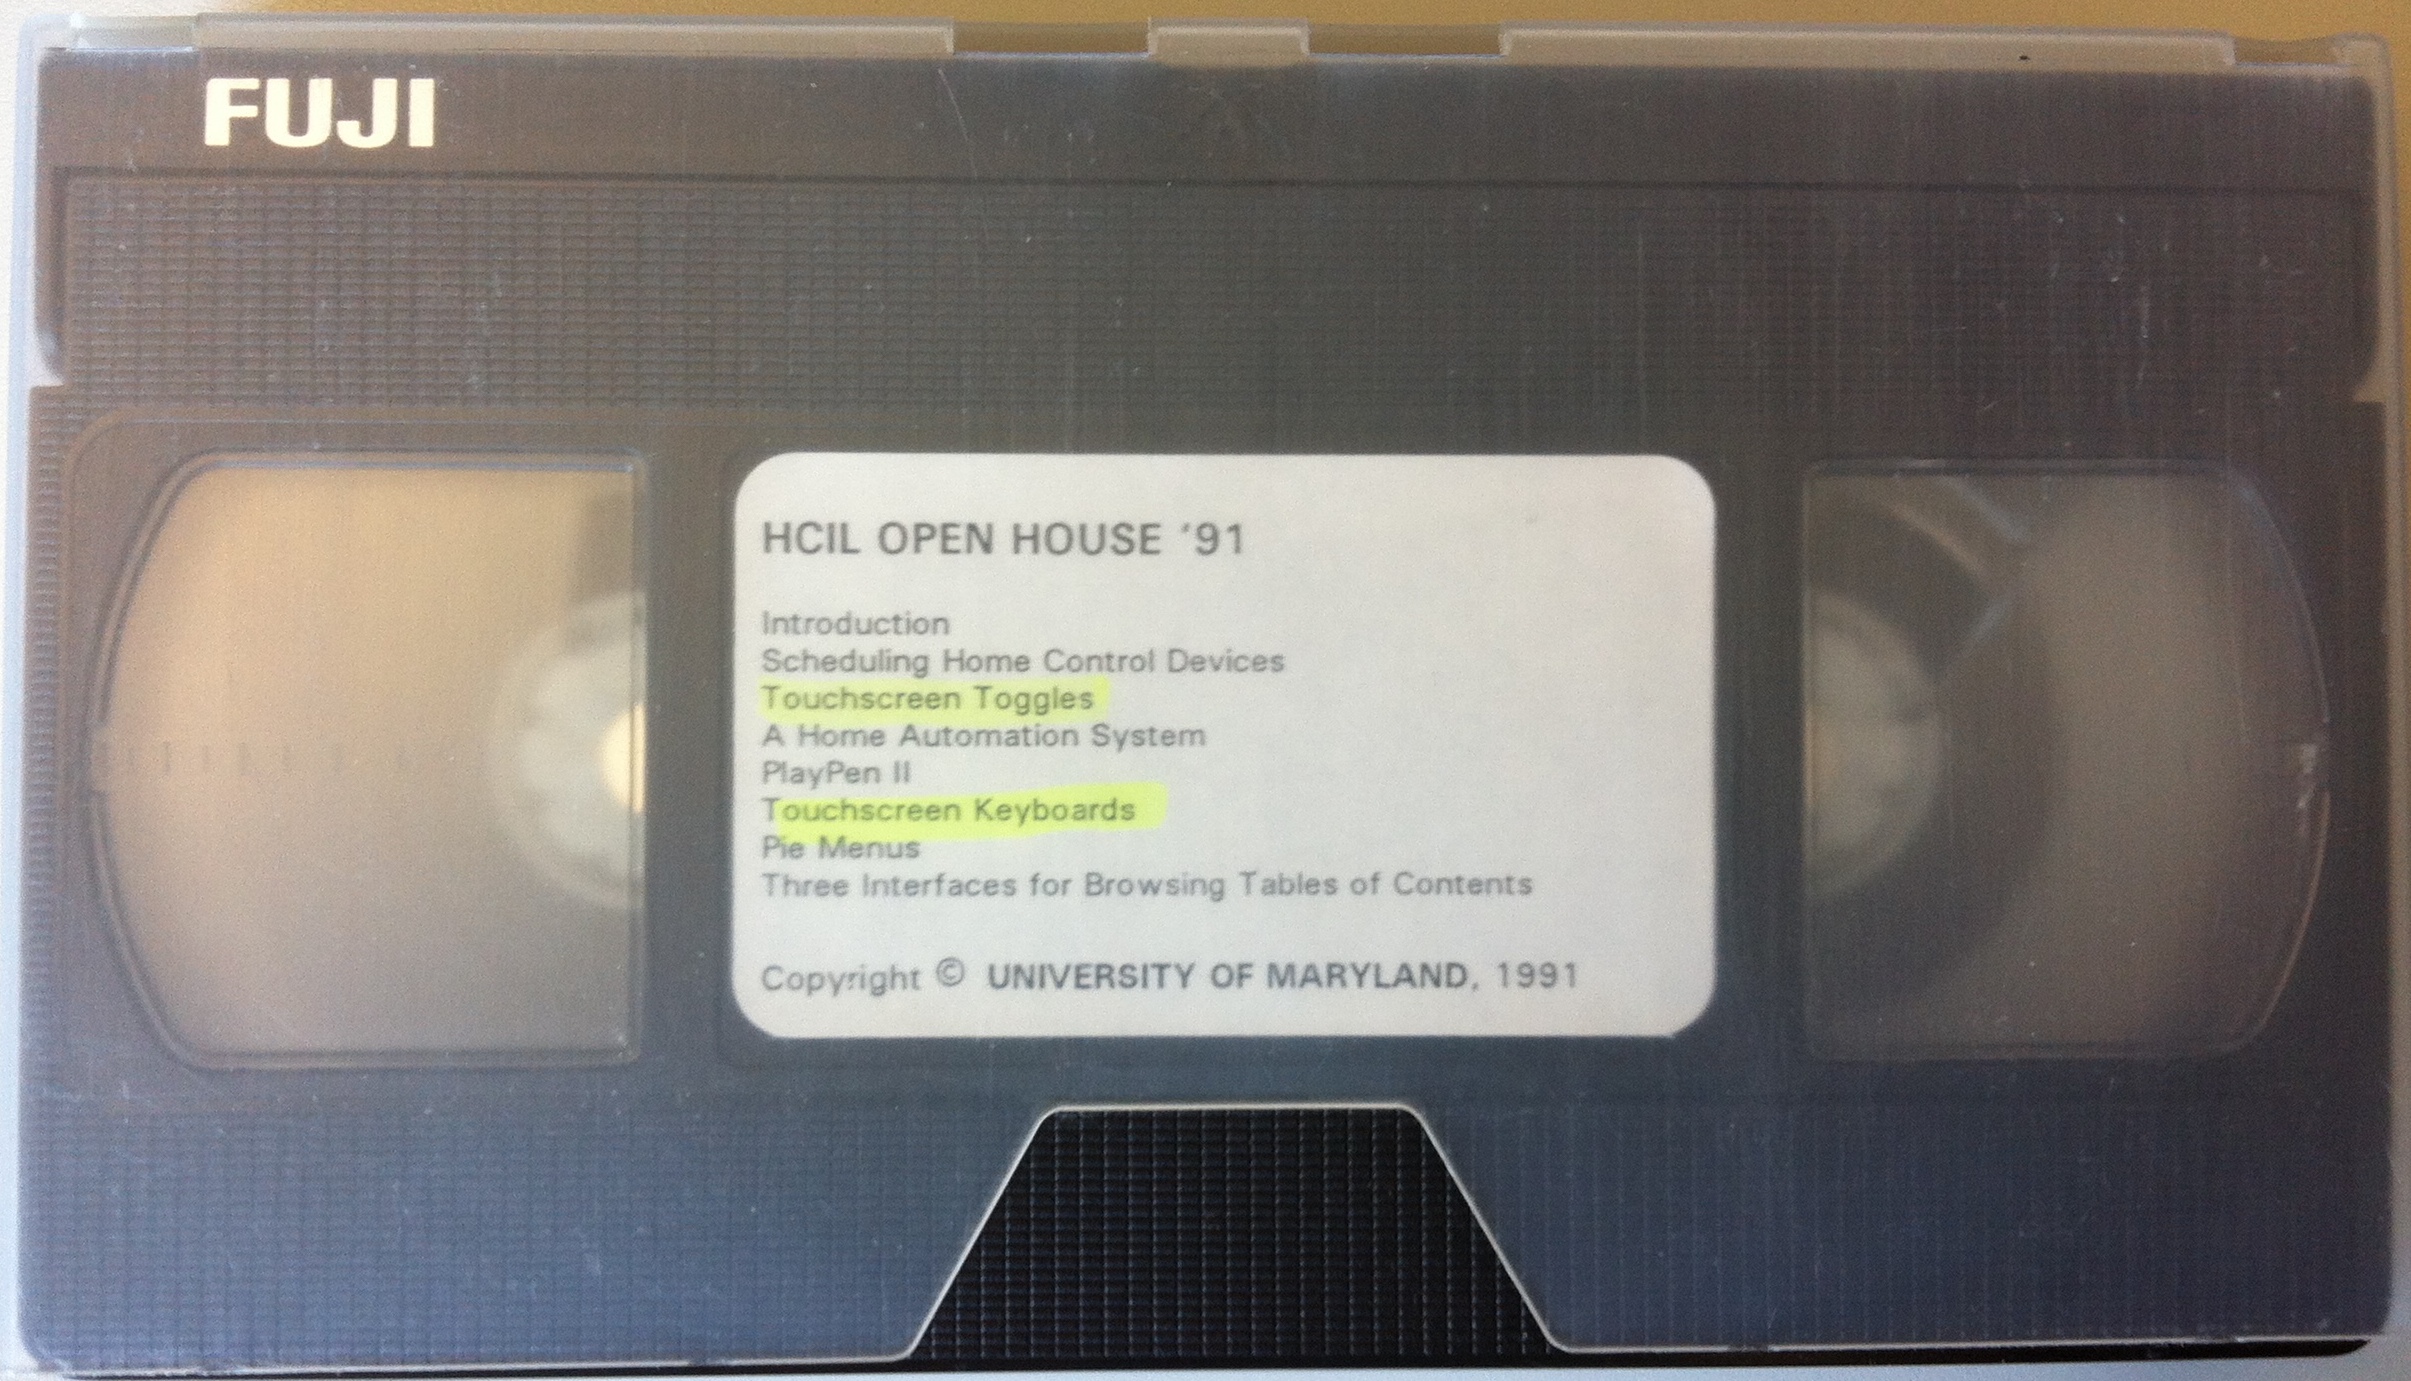
Scheduling home control devices (6:00)
C. Plaisant, B. Shneiderman
We describe three different user interfaces supporting the scheduling of home-control devices (such as VCR, air conditioning or furnace) over time periods ranging from minutes to days. The touchscreen-based user interfaces include a 12-hour clock, 24-hour dial and 24-hour linear prototypes. They are demonstrated on a PC-AT equipped with a touchscreen. User reactions were collected during an informal usability test. The reviewers’ feedback as well as the flexibility to add functionalities favor the linear representation.
Related Research Summary
Downloadable MPG (76 MB)
Touchscreen toggles (7:00)
C. Plaisant
We describe six different touchscreen based toggle switches allowing the control of two state devices by novice or occasional users. The user interfaces, ranging from button type toggles to sliding toggles are demon-strated on an IBM PC. Results from a formative usability test are given indicating that all the toggles described here can be used with very low error rates. The sliding toggles were rated harder to use and were least preferred. On the other hand they offer other advantages such as the reduction of the risk of undesired activation.
Related Research Summary
Downloadable MPG (86 MB)
Pie Menus (2:00)
D. Hopkins
A pie menu is a format where the items are placed along the circumference of a circle at equal radial distance from the center. Several examples are demonstrated on a Sun running NeWS window system, including the use of pie menu for window management, the simultaneous entry of 2 arguments (by using angle and distance from the center), scrollable pie menus, precision pie menus, etc.
Related Paper
Downloadable MPG (205 MB)
Softer Software: an excerpt from the Maryland State of Mind program
Extract from a public broadcasting review of HCIL projects showing early work on hypertext with mousable text links.
Related Research Summary
Downloadable MPG (118 MB)
1999
Introduction (2:58)
B. Shneiderman
Downloadable MPG (44 MB)
Query Previews for EOSDIS (1999 UPDATE) (7:02)
C. Plaisant and M. Venkatraman
Query Previews allow users to rapidly gain an understanding of the content and scope of a digital data collection. These previews present overviews of abstracted metadata enabling users to rapidly and dynamically avoid undesired data. This video summarizes our work on developing query previews for NASA Earth Science data. New developments include approaches that successfully address the challenge of multi-valued attribute data. Memory requirements and processing time associated with running these new solutions remain independent of the number of records in the dataset.
Downloadable MPG (93 MB)
Design Space for Data and label Placement for information visualization (7:39)
J. Li, C. Plaisant, B. Shneiderman
Placing numerous data objects and their corresponding labels in limited screen space is a challenging problem in information visualization systems. We demonstrate a variety of static and dynamic placement techniques, shown in the context of the LifeLines application. A control panel facilitates user customization of labels placement and aggregation mechanisms.
Downloadable MPG (102 MB)
Understanding the effect of incidents on transportation delays with a simulation based environment (4:28)
C. Plaisant, S. Keswani, P. Tarnoff
A simulation-based learning environment provide system designers and operators with an appreciation of the impact of incidents on traffic delay. We used SimPLE (Simulated Processes in a Learning Environment) which uses dynamic simulations and visualizations to represent realistic time-dependent behavior. Guidance material and other software aids facilitate learning. The simulation allows learners to close freeway lanes and divert traffic to an arterial road. Users can see the effect of the detour on freeway and arterial delay. Users can then adjust signal timing interactively on a time space diagram and watch the effect of their adjustment on green band changes and on arterial delays and total delays.
Downloadable MPG (60 MB)
Visualizing Legal Information: Hierarchical and Temporal presentations (7:21)
B. Allen, R. Feldman, C. Harris, A. Komlodi, B. Shneiderman
West Group provides online access to millions of legal precedents and statutes. However, because of the volume of information, which is presented textually, users often work hard to locate the most valuable items. Three visualizations were implemented to facilitate this task: (1) WebTOC shows search results in an outliner format using the familiar West Key Number System, which is a topical legal hierarchy, (2) Dotfire shows the same hierarchy as an axis of a 2-dimensional visualization that includes color-coded items grouped in grid cells, and (3) LifeLines shows the temporal history of a single case with horizontal timelines.
Downloadable MPG (99 MB)
Snap together visualization (4:31)
C. North, B. Shneiderman
Information visualizations with multiple coordinated views enable users to rapidly explore complex data and discover relationships. However, it is usually difficult for users to find or create the coordinated set of visualizations they need. Snap-Together Visualization allows users to coordinate visualizations to create customized multiple-view interfaces. Users query their relational database and load results into desired visualizations. Then they specify coordinations between visualizations for selecting, navigating, or re-querying. Developers can make independent visualization tools “snap-able” by including a few simple hooks.
Downloadable MPG (63 MB)
Designing PETS: A Personal Electronic Teller of Stories (7:49)
A. Druin, J. Montemayor, J. Hendler, B. McAlister, A. Boltman, E. Fiterman, A. Plaisant, A. Kruskal, H. Olsen, I. Revett, T. Plaisant Schwenn, L. Sumida, R. Wagner
In today’s homes and schools, children are emerging as frequent and experienced users of technology. As this trend continues, it becomes increasingly important to ask if we are fulfilling the technology needs of our children. To answer this question, we have developed a research approach that enables young children to have a voice throughout the technology development process. This video describes our research approach with a team of six children (ages 7-11 years old) and six adult researchers with experience in computer science, education, art, and robotics. In this video, we show our team at work to develop PETS: A Personal Electronic Teller of Stories. This is a new robotic pet that can support children in the storytelling process.
Downloadable MPG (105 MB)
Welcome to the HCIL-2 Kids First Kid-Made Video (3:41)
A. Kruskal, H. Olsen, I. Revett, T. Plaisant Schwenn, L. Sumida, & R. Wagner (with help from A. Druin, J. Montemayor, A. Boltman, L. Sherman, G. Chipman, and H. Alborzi)
This video is about what we do as kids making new technologies for kids. When our team of adults and kids work together, we start with something and keep on testing and then improving. Designing our robot is also a lot like an adventure. It’s a huge pile of challenges that never end. We use our imagination, legos, servos, computers, craft materials and lots of low-tech stuff. Our robot is very different from other robots. First of all, it has fur and most other robots do not. Our robot acts out certain emotions for stories that you write. Our robot has parts that you can put in different places unlike other robots. The last and the most important is that we made the robot with kids and adults. This robot shows how we all worked together.
Downloadable MPG (50 MB)
KidPad: A Collaborative Storytelling Environment for Children (3:11)
B. Bederson, A. Druin, J. Pablo-Hourcade, A. Boltman
Narratives are ubiquitous. Some argue that the fundamental element in life is the story and storytelling can be viewed as a framework for almost all communication. As such, storytelling can also be used as an approach to learning. Within our recently launched KidStory research project (in a collaboration with the European Union), storytelling is the focus for a set of tools and collaboration principles that we are developing. The technology tools we have come to see as important support co-present collaboration for children. This technique we call Single Display Groupware, where children can work together at the same computer as partners in creating a shared story. Our goal is to develop tools that will enhance children’s communication skills, expressive storytelling capabilities, and collaboration experiences.
Downloadable MPG (42 MB)
Softer Software: an excerpt from the Maryland State of Mind program (8:28)
A public broadcasting review of HCIL projects going back to early work on hypertext with mousable text links. It also covers recent efforts on information visualization, such as the Visible Human Explorer, and children as technology design partners.
Downloadable MPG (118 MB)
1998
Introduction (2:39)
Ben Shneiderman
Downloadable MPG (25 MB)
LifeLines: Enhancing Navigation and Analysis of Patient Records (7:41)
Catherine Plaisant, Jia Li et al.
Using the familiar metaphor of timelines, LifeLines takes advantage of our ability to visually analyze information-abundant displays, and facilitates access to the details in the medical patient record. A Java user interface presents a one-screen overview. Problems, diagnoses, test results, or medications can be represented as dots or horizontal lines. Zooming provides more details; line color and thickness illustrate relationships or significance. The visual display acts as a giant menu, giving direct access to the details.
Downloadable MPG (103 MB)
SimPLE: Simulated Processes in a Learning Environment (4:10)
Anne Rose
We have developed an application framework for creating simulation-based learning environments. We call it SimPLE. These environments use dynamic simulations and visualizations to represent realistic, time-dependent behavior; and are coupled with guidance material and other software aids that facilitate the learning process. The Software architecture enables independent contributions of both educational content (e.g., simulation models, guidance materials) and cognitive user environments such as user interface and software.
Downloadable MPG (52 MB)
Pad++: A Zooming User Interface (3:25)
Ben Bederson
This video demonstrates Pad++, a zooming user unterface (ZUI) designed for interactive graphical data creation and browsing. It takes the spatial metaphor standard from the computer window desktop interface one step further by incorporating the concept of scale. Pad++ is a two-dimensional surface that acts like a sketchpad, but is orders of magnitude larger in extent and resolution. This allows information to be created not only at any location, but at any size as well.
Downloadable MPG (41 MB)
LinKit: Tight Coupling for Flexible Mutiple-Window Coordination (7:28)
Chris North
LinKit prototypes demonstrate an end-user capability to coordinate windows for advanced information browsing. Pairs of wondows, when linked by the user, are tightly coupled so that browsing in one window causes continuous visual feedback in other windows.
Downloadable MPG (95 MB)
Query Previews for NASA EOSDIS: An Update (3:30)
Ben Shneiderman and Catherine Plaisant
The Earth Observation System Data and Information System will access very large NASA databases over computer networks. Query previews present an overview of the entire database, where users make rough selections over a small number of attributes. Queries are then refined over other database attributes, elimating zero-hit queries. We present the most recent version, in operation at NASA, for the Global Change Master Directory.
Downloadable MPG (46 MB)
Children as Our Technology Design Partners (6:22)
Allison Druin and Ken Weinstein
Children’s input into the design and development process is critical. New technologies for children has become a growing industry, an emerging area of research and an important educational tool for childhood learning. With the growing importance of these new technologies, this video shows new development methodologies that ask children to be technology design partners in an on-going intergenerational design team.
Downloadable MPG (86 MB)
Genex: An Introduction (17:21)
Ben Shneiderman
This video presents the opening of my CHI98 keynote address “Codex, memex, genex: The pursuit of transformational technologies.” Genex is a framework for an integrated set of software tools that support creatvity in science, medicine, the arts, and beyond. It’s comprised of four phases: (1) collect information from an existing domain of knowledge; (2) create innovations using advanced tools; (3) consult with peers or mentors in the field; and (4) disseminate the results widely. This presentation was built by Ben Bederson (with Allison Druin) using the innovative Pad++ zooming user interface.
Downloadable MPG (213 MB)
Genex: A Medical Scenario (11:42)
Ben Shneiderman
This video continues my CHI98 keynote address. It creates a medical scenario showing how a physician might treat a patient by appropriately using the four phases of Genex. This playful scenario begins when Dorothy Gale returns from Emerald City in the Land of Oz with a mysterious ruby red rash.
Downloadable MPG (150 MB)
Human Values for Shaping Educational Technology (7:32)
Ben Shneiderman
This extract from a satellite TV presentation focuses on the philosophy of “Relate-Create-Donate.” It suggests that students should work in teams to create ambitious projects, that they could not create individually, that should be meaningful to someone outside the classroom. A website with student project reports is shown. The full tape (WETC Keynote ’97 #35006) is available from Wisconsin Public Broadcasting Foundation, 3319 West Beltline Highway, Madison, WI 53713-4296.
Downloadable MPG (73 MB)
1997
Introduction (2:40)
Ben Shneiderman
Downloadable MPG (36 MB)
Bringing treasures to the surface: Previews and overviews in a prototype for the Library of Congress National Digital Library (7:30)
Catherine Plaisant, Anita Komlodi, Gary Marchionini, Ara Shirinian, David Nation, Steve Karasik, Teresa Cronnell, and Ben Shneiderman
We worked with a team from the Library of Congress (LC) to develop interface design components for LC’s American Memory collections of historical multimdeia materials. Our prototype illustrates the benefits of previews (such as samples, collections of thumbnails, and video previews) and overviews (such as timelines and automaticaly generated tables of contents) to facilitate the browsing of search results or entire collections.
Downloadable MPG (104 MB)
Viewing websites using a hierarchical table of contents browser: WebTOC (5:40)
David Nation
WebTOC is a new method of visualizing websites. It was first developed to browse large numbers of documents in the Library of Congress American Memory collections. WebTOC automatically generates a hierarchical table of contents of a site by following local links from the home page. The cumulative size, type, and number of items in branches of the hierarchy is shown graphically next to each link. WebTOC can also be used to show conventional file structures. A hierarchical multiple window WWW browser.
Downloadable MPG (71 MB)
Elastic Windows (5:00)
Ben Shneiderman and Eser Kandogan
Current WWW browsers are still primitive in that they do not support many of the user’s navigational needs. We propose a new browsing interface based on the Elastic Windows approach with hierarchical windows and multiple window operations. It provides a flexible organization where users can quickly organize and restructure the pages on the screen as they reformulate their goals.
Downloadable MPG (67 MB)
Using multimedia learning resources for the Baltimore Learning Community (6:50)
Becky Bishop and Josephus Beale
The Baltimore Learning Community (BLC) is a community of middle school teachers who share resources and exchange ideas through the use of Internet technology. We demonstrate how teachers can prepare and present an online learning unit using resources suc h as high-quality videos, still images, and on-line text, accessible via broad-bandwidth networking. A dynamic query search interface is used to select a resources indexed by subject content and by Maryland State Performance and Assessment Program (MSPAP) outcomes.
Downloadable MPG (92 MB)
Visual data mining using Spotfire (6:10)
Ben Shneiderman
Human perceptual abilities are remarkable at spotting orderly and unusual patterns, but current tools have not made good use of these abilities. Now, information visualization strategies such as the starfield display (originated at the University of Mary land) are spawning exciting commercial software tools such Spotfire from IVEE Development (www.ivee.com). Spotfire enables users to view tens of thousands of data points, with as many as five attributes per data point. It has powerful controls that enab le them to choose among dozens of attributes and then steer through the range of values within seconds. As the data points Educational philosophy for applying technology.
Downloadable MPG (83 MB)
Relate-Create-Donate (4:30)
Ben Shneiderman
This talk describes an evolving educational philosophy that can be a guide to applying advanced information and communication technologies. The philosophy is based on having students relate to team members to create something ambitious for some group outs ide the classroom. These authentic service-oriented projects can produce a high level of motivation among students and give them the satisfaction of building something useful for others.
Downloadable MPG (67 MB)
Query previews in networked information systems: The case of EOSDIS (4:30)
Catherine Plaisant, Tom Bruns, Ben Shneiderman, Khoa Doan
The Earth Observation System Data and Information System will access very large NASA databases over computer networks. Query previews present an overview of the entire database, where users make rough selections over a small number of attributes. Queries are then refined over all database attributes, elimating zero-hit queries often characteristic of networked databases.
Downloadable MPG
As others see us: HCIL & the Teaching/Learning Theater Extract from “Your ticket to technology: Beyond the horizon” (10:00)
Prepared by the Fairfax Network of Fairfax County Public Schools, Virginia, 4/23/97
An interview with Ben Shneiderman and one of his students about the University of Maryland Theater/Learning Theater, followed by a discussion of user interface design and demonstrations of Elastic Windows, Dynamic Queries, and the Visible Human Explorer.
Downloadable MPG (131 MB)
1996
Introduction (2:50)
Ben Shneiderman
Downloadable MPG (38 MB)
Elastic Windows for Rapid Multiple Window Management (6:49)
Eser Kandogan
With current approaches of window management, visibility and arrangement of multiple windows is a problem. We have developed a new windowing approach, called Elastic Windows, where windows are organized in a hierarchical fashion on a space filling tiled layout. It supports multiple window operations which enable fast task-switching and reorganization of the windows according to tasks.
Downloadable MPG (91 MB)
Life-Lines: Visualizing Personal Histories (6:43)
Catherine Plaisant, Anne Rose
In our project for the Maryland Department of Juvenile Services we are developing new techniques to visualize youth records by showing multiple time lines with selectable markers to retrieve detailed information. Overviews are always available even for complex records, zooming and filtering is possible, and linked events can be highlighted. We show how this technique can also be used to visualize medical patient record and personal histories.
Downloadable MPG (86 MB)
Designing Interfaces for Youth Services Information Management (4:57)
Jason Ellis, Catherine Plaisant, Anne Rose
We are working with Cognetics Corporation to redesign the information system used by the Maryland Department of Juvenile Justice (DJJ) to handle the processing of juvenile complaints. Our new design uses visualization techniques to display youth record overviews and worker specific screens to facilitate task scheduling and document management. This video demonstrates the screens for case workers, facility workers and resource coordinators. We believe the techniques used can be extended to other case management tasks both within and outside DJJ.
Downloadable MPG (66 MB)
Query Previews in Networked Information Systems : the Case of EOSDIS (4:23)
Catherine Plaisant, Tom Bruns, Ben Shneiderman, Khoa Doan
The Earth Observation System Data and Information System will access very large NASA databases over computer networks. Query previews present an overview of the entire database, where users make rough selections over a small number of attributes. Queries are then refined over all database attributes. This approach eliminates zero-hit queries often characteristic of networked databases.
Downloadable MPG (60 MB)
Baltimore Learning Communities (8:50)
Gary Marchionini, Allison Gordon, Tracy Vitek, Horatio Jabari-Kitwala, Victor Nulet
The Baltimore Learning Community is a community of middle school teachers who share resources and exchange ideas through the use of Internet technology. In this video, two teachers demonstrate some of the capabilities of the community by searching a resource database offering text, graphics and short video clips intended to supplement textbooks and motivate students. The resources are indexed by subject content and by Maryland State Performance Outcomes and are accessible through a dynamic query search interface.
Downloadable MPG (122 MB)
Visual Information Seeking using the FilmFinder (Extract from the HCIL 1994 Video Report) (6:12)
Christopher Ahlberg, Ben Shneiderman
FilmFinder allows users to explore a large film database. By applying the dynamic queries approach to filtering information, a continuous starfield display of the films, and tight coupling among the components of the display, the FilmFinder environment encourages incremental and exploratory search.
Downloadable MPG (113 MB)
1995
Introduction and table of contents
Ben Shneiderman
An introduction to the Human-Computer Interaction Laboratory, also demonstrating a revised version of the FilmFinder, a visual information seeking environment for browsing films.
Downloadable MPG (41 MB)
Using Dynamic Queries for Youth Services Information
Anne Rose, Ajit Vanniamparampil
IVEE (Information Visualization & Exploration Environment) is a generic tool for the automatic creation of dynamic query applications. In our work for the Maryland Department of Juvenile Services, we use IVEE to explore a dataset of approximately 5000 juvenile case referrals. We demonstrate how IVEE can be used to find errors, compare workloads, and reason about display patterns.
Related Project Page
Downloadable MPG (65 MB)
Life-Lines: Visualizing Personal Histories
Brett Milash, Anne Rose
In our project for the Maryland Department of Juvenile Services we are developing new techniques to visualize youth records. By showing multiple time lines with selectable markers to retrieve detailed information, overviews are always available even for complex records. Zooming and filtering are possible and linked events can be highlighted. We show how this technique can be used to visualize medical patient record and personal histories.
Related Project Page
Downloadable MPG (76 MB)
Dynamic Queries and Pruning for Large Tree Structures
Harsha Kumar
The PDQ (for Pruning with Dynamic Queries) Tree-browser presents trees in two tightly-coupled node-link views: a detailed view and an overview. Users can use dynamic queries to filter nodes at each level of the tree. The dynamic query panels are user-customizable, i.e. users can select what node attributes to query on. Subtrees of unselected nodes are pruned out, leading to compact views of relevant nodes after a series of iterative refinements.
Downloadable MPG (57 MB)
Browsing Anatomical Image Databases : the Visible Human
Flip Korn, Chris North
The National Library of Medicine is preparing an archive consisting of anatomical images of a male and a female subject, including MRI, CT and cryosection images. This collection of images will be available to a large community of users with varying backgrounds and expertise. We are exploring visual metaphors for browsing and querying anatomy databases. Our first prototypes include novel overview techniques for rapid exploration of volumetric data, and for browsing medical concepts and anatomical terms.
Related Project Page Downloadable MPG (81 MB)
Spinning Your Web: WWW Interface Design Issues
Vince Boisselle
Careful design of the hypermedia documents used on the World Wide Web (WWW) is necessary for building an effective WWW site. Using the mixed media holdings of a small library as an example, several design guidelines, aimed at making a site more efficient for the user in the navigation / retrieval process, are presented.
Downloadable MPG (37 MB)
BizView : Managing Business and Network Alarms
Wei Zhao and Rina Levy
We demonstrate a network monitoring prototype dealing with both physical network alarms (e.g. a node is down) and alarms generated by sensors installed in the business applications running on the network (inventory too low or too high, excessive number of orders, etc.). Our Enterprise Monitoring prototype provides tightly coupled filtered views of the networks current status and past history, timelines of alarm overviews and traditional textual details. Filtering attributes are modified interactively to deal with temporary needs or alarm overflows.
Related Project Page
Downloadable MPG (83 MB)
Animated Specifications Using Interaction Object Graphs
David Carr
Interpretation of specifications is a difficult and error prone task. If a specification method is executable and graphical, the specification can be animated while the system is executed. Interaction Object Graphs (IOGs) are an executable, graphical specification method. IOGs are designed to specify user-interface widgets. This video explains IOGs and demonstrates their animation while the user operates the specified widget. Animation of graphical specifications has the potential to enhance specification utility by enhancing both debugging and communication.
Downloadable MPG (129 MB)
WinSurfer: Treemaps for Replacing the Windows File Manager
Marko Teittinen
WinSurfer is a directory maintenance tool running in MS Windows and using treemaps. Treemaps are a novel method for displaying hierarchical information using a 2-D space filling algorithm that partitions a rectangular region. WinSurfer lets you gracefully and rapidly examine your directory and invoke file actions.
Downloadable MPG (76 MB)
1994
Introduction and table of contents (3:18)
Ben Shneiderman
An introduction to the Human-Computer Interaction Laboratory, mentioning TreeViz-PC, a treemap directory maintenance tool running in Windows.
Downloadable MPG (40 MB)
Visual information seeking using the FilmFinder (6:12)
Christopher Ahlberg, Ben Shneiderman
FilmFinder allows users to explore a large film database. By applying the dynamic queries approach to filtering information, a continuous starfield display of the films, and tight coupling among the components of the display, the FilmFinder environment encourages incremental and exploratory search.
Downloadable MPG (83 MB)
Organization overviews and role management – Inspiration for future desktop environments (9:39)
Catherine Plaisant, Ben Shneiderman
In our exploration of future work environments for the World Bank we propose two concepts. Organization overviews provide a consistent support to present the results of a variety of manual or semi-automated searches. This view can be adapted or expanded for each class of users to finally map the multiple personal roles an individual has in an organization. After command line interfaces, graphical point and click interfaces, and the current “docu-centric” designs, the natural direction is towards a role-centered approach where we believe the emphasis is on the management of those multiple roles. Each role involves coordination with groups of people and accomplishment of tasks within a schedule.
Downloadable MPG
Visual decision-making: using treemaps for the analytic hierarchy process (8:34)
Toshiyuki Asahi, Ben Shneiderman, David Truro
The analytic hierarchy process, a decision-making method based upon division of problem spaces into hierarchies, is visualized through the use of treemaps, which pack large amounts of hierarchical information into small screen spaces. The problem of construction site selection is considered in this video. Apart from its traditional use for problem/information space visualization, the Treemap also serves as a potent visual tool for “what if” type analysis.
Downloadable MPG (112 MB)
Visual information management for satellite network configuration (8:49)
Catherine Plaisant, Harsha Kumar, Marko Teittinen, Ben Shneiderman
Our prototype network configuration management system illustrates the benefits of compact overviews of the network and the tasks. General purpose tools are available to visualize and query the network, access detail information and gather elements relevant to the task. The Treemap combined with dynamic queries proved well-suited to deal with the multiple containment hierarchies in networks. The TreeBrowser uses the more conventional node-link visualization of trees, and tightly coupled overviews linked to detailed views.
Downloadable MPG (105 MB)
Graphical macros: a technique for customizing any application using pixel-pattern matching (9:49)
Richard Potter
Triggers is a Graphical Macro system that allows users to customize and add functionality to applications. Graphical Macros work by simulating the actions of the user and introduce the novel technique of scanning the pixel representations of the graphical user interface. The Graphical Macro technique allows Triggers to customize any application. Example customizations are shown for spreadsheet, drawing, word processing, and file management applications.
Downloadable MPG (133 MB)
Education by engagement and construction: can distance learning be better than face to face? (15:00)
Ben Shneiderman
An emerging theory of “education by engagement and construction” is described, in which students work in teams to create ambitious projects with results that are presented to someone other than the professor. The video shows how a distance learning Graduate Computer Science Seminar titled “Virtual Reality, Telepresence and Beyond” was con-ducted according to this theory. The intense interactions by satellite TV and electronic mail may have created a greater sense of interaction and intimacy among the students than many face-to-face courses.
Downloadable MPG (186 MB)
Dynamic queries demos: revised HomeFinder and text version plus health statistics atlas (9:40)
Ben Shneiderman
Because of the great interest in Dynamic Queries we are making these video demos available for instructional and training purposes. We appreciate the cooperation of the University of Maryland Instructional Television, which produced the original 5-hour User Interface Strategies ’94 program. Dynamic Queries are user controlled displays of visual or textual information. Ben Shneiderman presents the HomeFinder (developed by Chris Williamson), followed by the text version (Vinit Jain) and the Health Statistics Atlas (Catherine Plaisant and Vinit Jain).
Downloadable MP4 (72 MB)
CHI ’94 slide and video show
Downloadable MPG (76 MB)
1993
Introduction and table of contents (4:00)
Ben Shneiderman
An introduction to the Human-Computer Interaction Laboratory, mentioning our in-depth review of five platform independent UIMS, and a brief presentation of the AlphaSlider for selecting stored phrases or names rapidly.
Downloadable MPG (56 MB)
Dynamaps: dynamic queries on a health statistics atlas (6:34)
Catherine Plaisant and Vanjiy Jain
Dynamic queries are user controlled animated displays of visual or textual data. On a prototype developed with the National Center for Health Statistics and running on a common PC, a thematic map of the United States is animated by moving a time slider to illustrate time trends of mortality rates. Other sliders filter out parts of the map according to parameters such as demographics. The patterns of disappearance can illustrate possible correlations.
Downloadable MPG (87 MB)
Hierarchical visualization with Treemaps: making sense of pro basketball data (10:47)
Dave Truro
Treemaps are shown to effectively visualize the hierarchy of the National Basketball Association, with its divisions, teams and over 450 players. The diagram springs to life with the addition of animation and data distortion, techniques which allow the user to alter the diagram’s appearance and hence discover new information about the underlying data. The addition of other features such as size inversion and color queries creates a very capable — and customizable — tool.
Downloadable MPG (146 MB)
TreeViz(TM): file directory browsing (10:04)
Brian Johnson
TreeViz(TM) is a Macintosh implementation of treemaps and a powerful tool for visualizing large hierarchical and categorical data spaces. This graphical data visualization technique displays individual elements in an organized mosaic presentation of the entire data space. TreeViz(TM) enables users to build accurate mental models of the content and structure of large hierarchies such as the file hierarchy in this video with 100 directories and 1000 files. The metaphor of nested relative bar and column charts is used to simply and powerfully explain the concept of visualizing hierarchically structured data spaces.
Downloadable MPG (136 MB)
HyperCourseware: computer integrated tools in the AT&T Teaching Theater (7:08)
Kent Norman
HyperCourseware is a prototype environment for an electronic classroom in which each student has a workstation networked to the instructorÕs workstation. It is a hypermedia infrastructure that ties together all of the tools and course materials of the traditional classroom into a collabor-ative, interactive network. Among the modules shown are the home screen for navigation, the syllabus module, lecture modules, the seating chart, and collaborative tools for sharing of ideas and notes.
Downloadable MPG (96 MB)
Improving access to medical abstracts: Grateful Med Interface prototype (6:08)
Gary Marchionini
A character-based interface and a GUI were developed for a retrieval system used by physicians and medical students to access the MEDLINE databases at the National Library of Medicine. The design was con-strained by the existing system architecture and experience base of users and thus represents an incremental approach to interface evolution. A case-based approach to the problems of no hits and too many hits was taken.
Downloadable MPG (83 MB)
Layout appropriateness: guiding interface design with simple task descriptions (4:00)
Andrew Sears
Designers often create screen displays that are sub-optimal for the tasks users perform. We integrated simple task sequences and frequencies into the design and evaluation process. Our Layout Appropriateness metric, validated in two studies, offers practical guidance to designers. Split menus applied these ideas to develop a new menu organization which results in faster selections and higher user preference ratings.
Downloadable MPG (54 MB)
1992
Introduction (3:00)
Ben Shneiderman
An introduction to the Human-Computer Interaction Laboratory, a brief update on the high-precision touchscreen developments (touchscreen keyboards and music instruments) and table of contents of the video.
Downloadable MPG (38 MB)
Dynamic Queries: database searching by direct manipulation (10:55)
Ben Shneiderman, Chris Williamson, Christopher Ahlberg
Dynamic queries allow users to incrementally adjust a database query (with sliders) or easily select from a set of discrete attribute values coupled with a visual display of results that are rapidly updated. Dynamic queries on the chemical table of elements and a real estate database are demonstrated.
Downloadable MPG (147 MB)
Treemaps for visualizing hierarchical information (11:25)
Ben Shneiderman, Brian Johnson, Dave Turo
Treemaps are a novel method for displaying hierarchical information using a 2-D space-filling algorithm that partitions a rectangular region. This allows hierarchies of several thousand items to be displayed at once on a normal monitor. Applications dealing with file structures and sales management are demonstrated.
Downloadable MPG (154 MB)
Three strategies for directory browsing (10:30)
Rick Chimera
Three applications of treemaps and dynamic queries to directory browsing. (1) Top-down Treemaps retain the tree structure as viewed in a node-link graphic form. (2) Value Bars: a lightweight information visualization and navigation tool for multi-attribute listings and tables. Value bars have navigation and graphic characteristics similar to scrollbars and give an attribute value overview for the entire listing or table. (3) Dynamic Queries Directory Browsing allow users to interactively filter out files not satisfying criteria value.
Downloadable MPG (142 MB)
Filter-Flow metaphor for boolean queries (6:35)
Degi Young, Ben Shneiderman
Evidence shows that users of database or information systems have diffi-culties specifying complex boolean queries. We present a novel visual presentation based on water filter-flow metaphors that reveals the effect of selectors and operators (AND, OR and NOT) on query outcome.
Downloadable MPG (89 MB)
The AT&T Teaching Theater: active learning through computer supported collaborative courseware (8:25)
Kent Norman
The University of Maryland has developed an electronic teaching theater to explore use of computer-based technology in the classroom of the future. The focus is on methods to encourage collaboration and communication through the use of computering networking, video switching, and computer controlled audio/visual equipment connected to large screen projectors and student workstations. Examples of “HyperCourseWare” allow students to browse through the course syllabus, lecture notes, examples, assignments, and a class roll. In addition, the software provides online exams with immediate group results, feedback monitoring during lectures, online sharing of ideas and questions, and a “power blackboard” listing and showing steps in solving problems. Initial reactions by the students in six classes have been positive.
Downloadable MPG (115 MB)
ACCESS: an online public access catalog at the Library of Congress (8:15)
Gary Marchionini
The Library of Congress ACCESS system is a touchscreen online public access catalog (OPAC) for novice and casual users. Eighteen stations find popular use in the Computer Catalog Center, allowing users easy access to the LC collection and freeing reference librarians from many user instruction responsibilities. The design of the system was facil-itated by collaboration between the HCIL and LC Automated Systems Office throughout the design, implementation, and evaluation processes.
Downloadable MPG (102MB)
Remote Direct Manipulation: a telepathology workstation (7:30)
Catherine Plaisant, David Carr
As a form of telepresence, telepathology allows pathologists to render a diagnosis by examining specimens under a remotely controlled microscope. To allow rapid navigation the interface must account for the inherent time delays of the system and incomplete feedback. We demonstrate our simulator and several alternative interfaces.
Downloadable MP4 (55MB)
Guiding automation with pixels: a technique for programming in the user interface (11:50)
Richard Potter
TRIGGERS is a programming system that tests for pixel patterns on the Macintosh display and manipulates the computer by sending mouse and keyboard events to the Macintosh user interface or by modifying the programming system’s state information. The result is a macro programming system with full computational generality and significant access to data in any application on the Macintosh. TRIGGERS shows how the inherent visual nature of pixels and the user’s extensive familiarity with the display content can make a programming system that is powerful and enjoyable to use.
Downloadable MPG (60MB)
1991
Introduction
Ben Shneiderman
Downloadable MPG (44 MB)
Scheduling home control devices
Catherine Plaisant, Ben Shneiderman
We describe three different user interfaces supporting the scheduling of home-control devices (such as VCR, air conditioning or furnace) over time periods ranging from minutes to days. The touchscreen-based user interfaces include a 12-hour clock, 24-hour dial and 24-hour linear prototypes. They are demonstrated on a PC-AT equipped with a touchscreen. User reactions were collected during an informal usability test. The reviewers feedback as well as the flexibility to add functionalities favor the linear representation.
Downloadable MPG (76 MB)
Touchscreen toggles
Catherine Plaisant
We describe six different touchscreen based toggle switches allowing the control of two state devices by novice or occasional users. The user interfaces, ranging from button type toggles to sliding toggles are demon-strated on an IBM PC. Results from a formative usability test are given indicating that all the toggles described here can be used with very low error rates. The sliding toggles were rated harder to use and were least preferred. On the other hand they offer other advantages such as the reduction of the risk of undesired activation.
Downloadable MPG (86 MB)
A home automation system
Reuel Launey (Custom Command Systems)
A complete home automation system is demonstrated, showing how the entertainment, security and climate control systems are easily controlled. The graphic user interface uses floor plans, calendars, time lines, and many direct manipulation techniques. The video also shows the product version of the scheduler prototyped at HCIL.
Downloadable MPG (92 MB)
PlayPen II (now known as PenPlay II): A novel fingerpainting program
Andrew Sears, Ben Shneiderman
PenPlay II is an entertaining software package which allows users to draw directly onto the computer monitor using either a touchscreen or a mouse. In addition to being entertaining, PenPlay II demonstrates the use of the location of a touch, direction of movement, and the speed of movement as input. Ten patterns can be generated, several of which are speed and direction sensitive.
Downloadable MPG (95 MB)
Touchscreen keyboards
Andrew Sears, Ben Shneiderman
The effect of keyboard size on typing rates is investigated. Four key-board sizes, ranging from 7 to 25cm wide, were used by both novices and experienced users. Novices typed between 10 and 20 words per minute (WPM) depending on the size of the keyboard. Experienced users typed between 20 and 30 WPM. A brief demonstration of the four keyboards is given followed by an overview of the experimental results.
Downloadable MPG (60 MB)
Pie menus
Don Hopkins
A pie menu is a format where the items are placed along the circum-ference of a circle at equal radial distance from the center. Several examples are demonstrated on a Sun running NeWS window system, including the use of pie menu for window management, the simulta-neous entry of 2 arguments (by using angle and distance from the center), scrollable pie menus, precision pie menus, etc.
Downloadable MPG (205 MB)
Three interfaces for browsing tables of contents
Rick Chimera
Three different interfaces were used to browse a large (1296 items) table of contents. A fully expanded stable interface, expand/contract interface, and multi-pane interface were studied in a between-groups experiment with 41 novice participants. We found that both the expand/contract and multi-pane interfaces produced significantly faster times than the stable interface for many tasks using this large hierarchy. The animation char-acteristics of the expand/contract interface appear to play a major role.
Downloadable MPG (169 MB)
Purchasing Information: For many years the videotapes and DVDs were available for purchase. For more information about the history of the video reports or the contents of the video reports contact Catherine Plaisant plaisant@cs.umd.edu