Document Reading with Visual Aids
Work done in collaboration between University of Maryland and Adobe Research introduces the concept of an “elastic” form a document that adapts its view based on content, the reader’s goals, and the reading device. Our user evaluations have shown the power of the elastic documents approach in summarization and comprehension of data-rich documents that contain complex data tables and text.
By Sriram Karthik Badam, Leo Zhicheng Liu, and Niklas Elmqvist
The PDF format is universal for recording information into an electronic document that can be easily shared over email or the cloud. PDF viewers (e.g., Adobe reader) can be used on any device to read PDF documents. However, these viewers work independently of the content of the document. Even if the document has related content across sections and pages, the document viewer steamrolls the document into a flat sequence—showing one page after another—that is not ideal for many documents. For instance, let’s consider academic papers that report experimental results across many pages, or consider a report released by a public agency like UNICEF or WHO to share results from their activities in different countries. Such documents are typically rich with data tables and pictures, often organized far away from the referring text. In a way, these documents are media collections—text, images, tables, videos, data, and formulas—by themselves. Reading such documents on current document viewers is hard, especially on mobile devices with small screens. Figure 1 shows an example of a data-rich document.
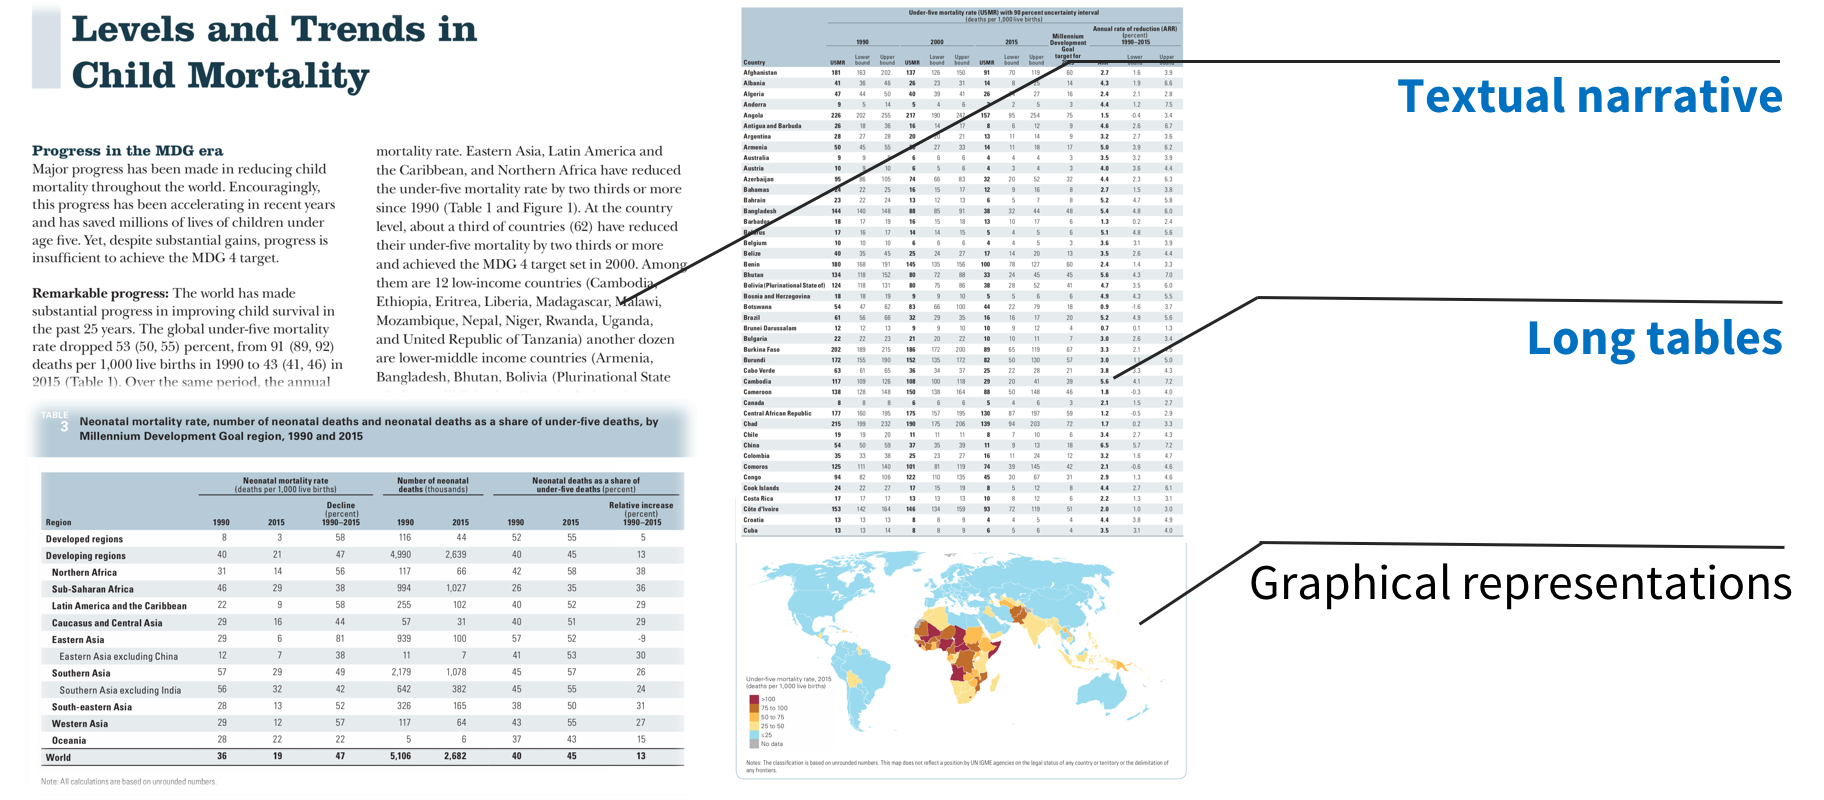
Figure 1: An example data-rich document from UNICEF about child mortality.
In our recent paper published at the IEEE Conference on Information Visualization (to appear in the IEEE TVCG journal), we automatically adapt document content by linking text and tables using visual aids based on the user’s focus in the document. By doing so, we introduce the concept of “Elastic Documents” that treats documents as a collection of multimedia content that is filtered, rearranged, and presented based on the readers’ goals as well as the capacity of the display itself.
Reading data-rich documents ain’t easy!
Data-rich documents contain data in different forms—text, tables, and pictures. When reading the text, it becomes the reader’s job to understand the corresponding data from the other content types. This can be hard if the reader has to flip back-and-forth across pages, which is common, or even take multiple passes through the document. For instance, in the above UNICEF mortality report, the text describes patterns in mortality rates over time for countries in developing and developed worlds that need to be fully grasped by relating the text to structured data tables in the appendices.
In our Elastic Documents approach, as the reader starts going through the document sentence by sentence, relevant visualizations are generated in the margins by extracting keywords from the text and matching them to the table content to find relevant data. Figure 2 shows the interface for the Elastic Documents approach with the visual aids presented in the right margin.
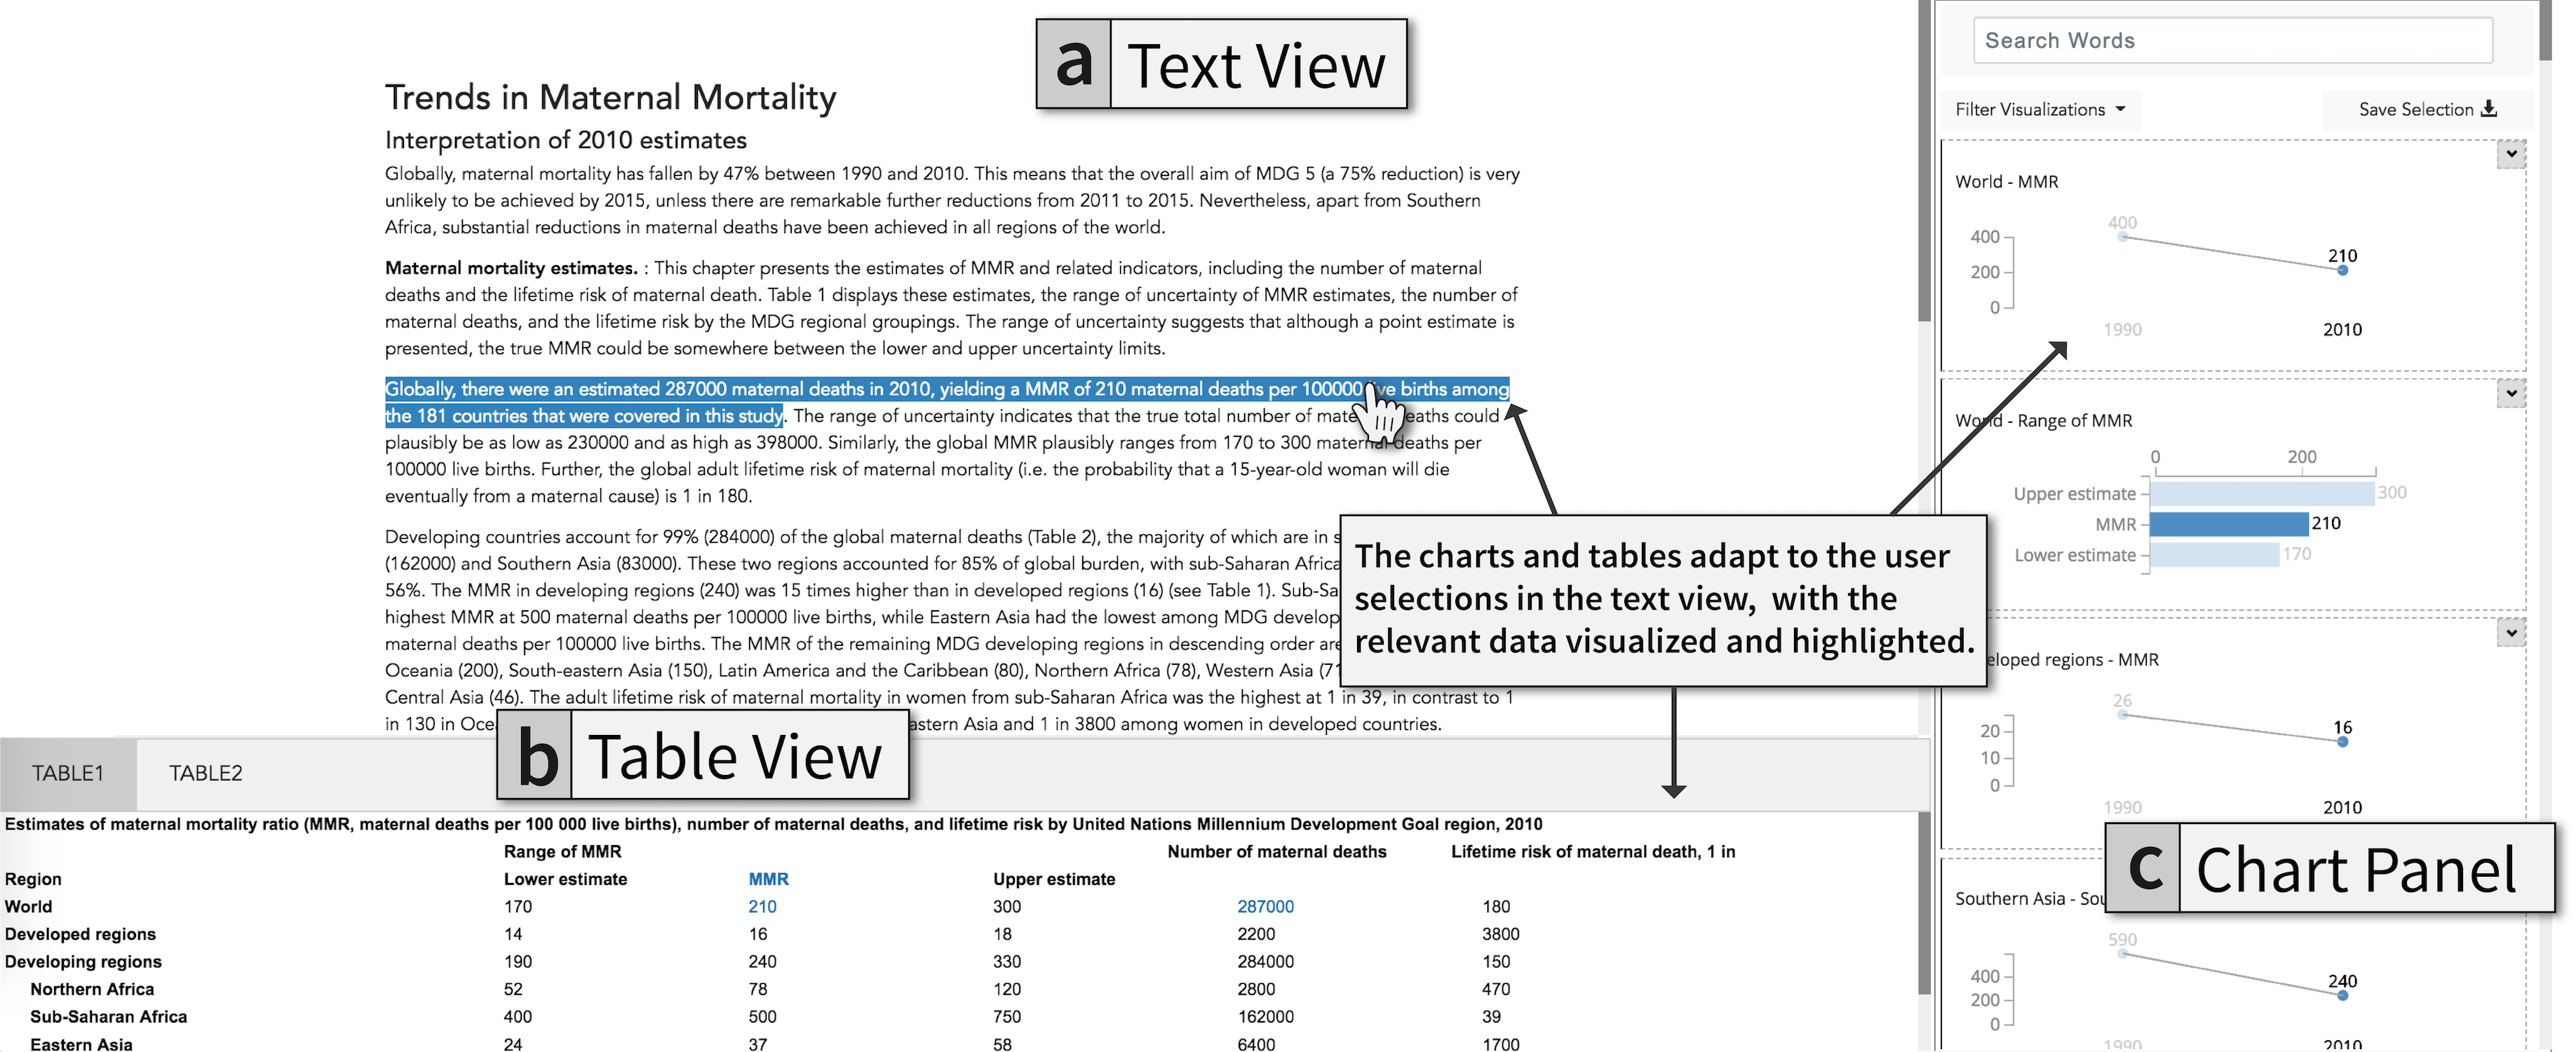
Figure 2: Our user interface for Elastic Documents generates visualizations to connect text and tables.
The Elastic Documents approach for linking text and tables
Elastic Documents represents a visual analytic approach to document reading. It processes a data-rich PDF document—containing text and data tables—in three steps: (1) extracting data from tables, (2) creating visualizations, and (3) highlighting visualizations based on the user’s focus. In the first step, the data tables in the PDF document are parsed and analyzed . For example, child mortality data related to developing vs. developed regions, and individual countries within these regions can be organized into a tree, where each level in the tree represents subsets for specific regions. These sets are then visualized as bar and line charts depending on the nature of the data. Bar and line charts are easy to understand while reading the document and do not deviate the reader from the primary task of reading the text. Finally, the user’s position in the document is represented by the keywords in view, that are then matched with the visualizations to rank relevant ones and highlight the matches.
Through this process, any data-rich document can be converted into an elastic structure that changes the content based on the reader’s focus. The content can also be manually adapted by the reader by choosing certain attributes to focus on. Figure 3 shows an example of the document viewer following the Elastic Document approach for the UNICEF child mortality report.
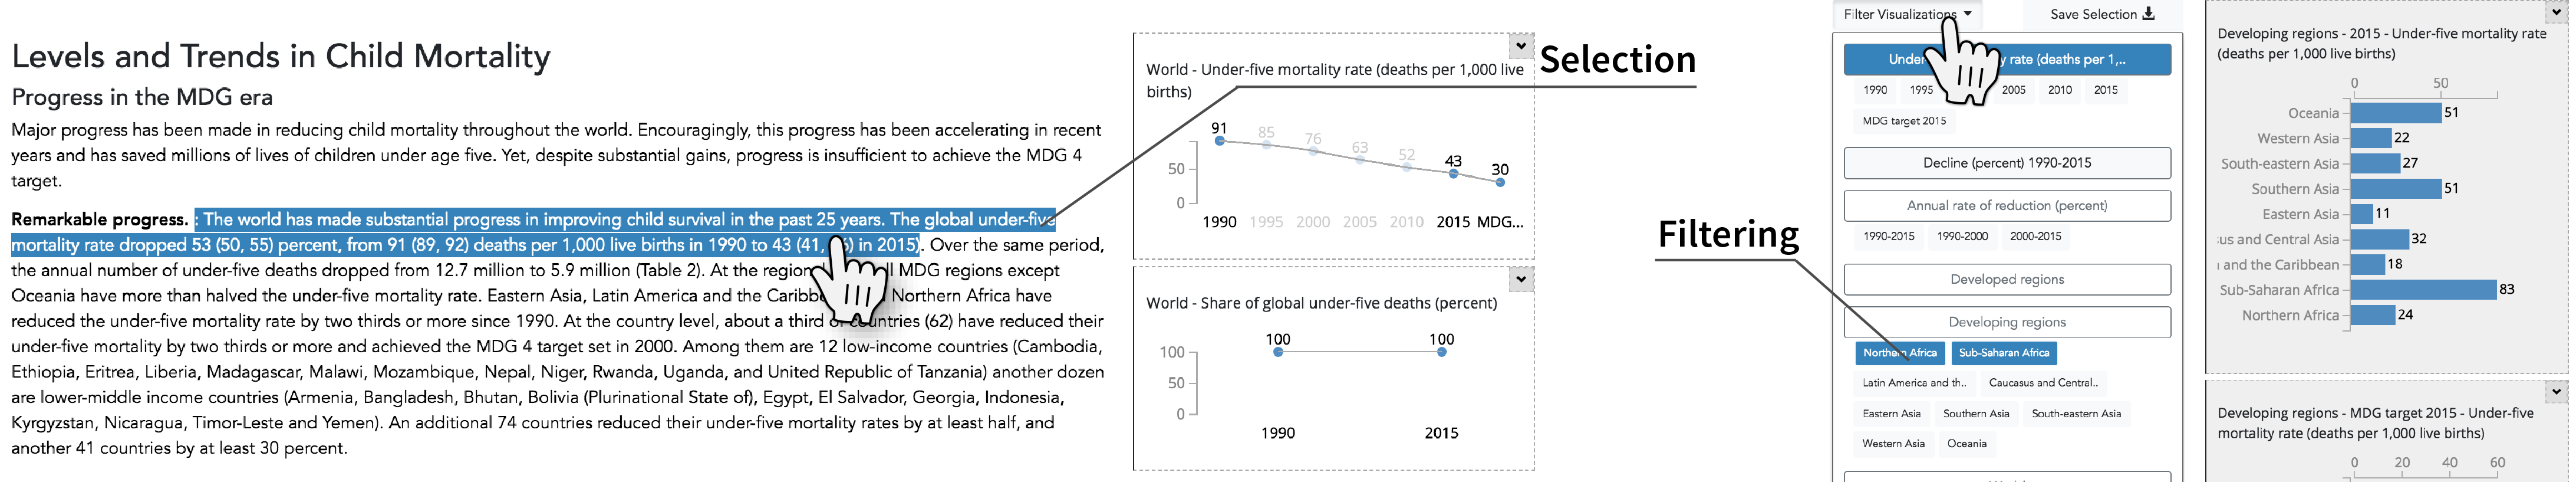
Figure 3: User interactions with a data-rich document in our Elastic Documents approach: text selection and attribute filtering.
Better Summarization and Comprehension with Elastic Documents!
The Elastic Documents promises a simpler reading experience, so we were interested in learning its benefits in standard reading tasks such as summarization and comprehension. We recruited 14 participants in a laboratory study to use both Elastic Documents and a baseline PDF viewer (similar to Adobe Reader). We recorded their summaries of the documents and answers to specific questions about the data within the documents. We found that,
- Elastic Documents led to more data-rich statements—statements that refer to certain data from tables to reinforce the takeaway.
- When using Elastic Documents, participants discussed more data attributes (topics within the text) than the baseline. As one participant said, “The interface automatically shows relevant information when I click a sentence, so it sometimes showed useful information to understand the text.” This could have helped participants generate more comprehensive summaries.
- Visualizations played different roles in document reading. They allowed for “visual search and summarization that took more time to attempt if simply done using tables or the text corpus”. The visualizations also “acted as a good sanity check when summarizing the gist of a particular sentence. The filtering [option] helps to hunt down forgotten values without scanning through the text again.”
Future of Elastic Documents
We believe that we have just scratched the surface of creating elastic document structures by linking tables and text. In the future, we will also want to better understand which visual aids are suitable for document reading. We also want to explore other forms of user interfaces for viewing elastic documents. Finally, adapting to different devices is a logical next step to better support document reading. After all, more and more users these days read documents on their smartphones and tablets.
Links
Paper: https://karthikbadam.github.io/assets/data/elastic-documents.pdf
Video preview: https://vimeo.com/289784966
Data-rich documents collection: http://ter.ps/datadocs
Publication:
Sriram Karthik Badam, Zhicheng Liu, Niklas Elmqvist (2019). Elastic Documents: Coupling Text and Tables through Contextual Visualizations for Enhanced Document Reading. IEEE Transactions on Visualization & Computer Graphics, to appear, 2019.