Vistrates: A versatile tool for data analytics
Vistrates is a platform for a wide range of analytical activities from visual exploration to presentation. Each document in Vistrates (a vistrate) combines many analytical components into a flexible user interface based on the sensemaking activity and target users—in contrast to existing tools that are built for specialized activities and users. A vistrate is also web-based and collaborative by nature, thus supporting data analysis anywhere, anytime, and by anyone.
By Sriram Karthik Badam, Andreas Mathisen, Roman Rädle, Clemens Klokmose, and Niklas Elmqvist
Understanding real-world data is a complex activity that often requires multiple sessions with multiple users working together and often involving multiple devices. For instance, at major tech companies such as Apple, Microsoft, and Google, typical product planning teams consist of executives, data scientists, programmers, and marketers working together to drive innovation and the next generation of products by understanding data, generating insights, creating stories, and communicating them to the stakeholders. These collaborators will all use different software depending on their skills and roles; Tableau and Microsoft PowerBI for point-and-click data analysis, Microsoft Excel for spreadsheets, Microsoft PowerPoint for presentations, and Jupyter notebooks for script-driven data analysis. Helping these teams work together thus means building bridges between all these specialized tools, which is not a trivial exercise.
Elmqvist and Irani (2013) proposed the term ubiquitous analytics to describe this kind of scenarios involving collaborative data analysis across many devices in anywhere and anytime settings. In our recent research paper, published at the premier IEEE VIS 2018 conference, we present Vistrates, a platform for ubiquitous analytics that enables a range of data analysis activities from data exploration to presentation. Vistrates introduces the concept of analytical components as building blocks of data analysis that can be composed together in data pipelines—e.g., a clustering component can be used to group data points and present them using a scatterplot component. Figure 1 shows an overview of the features in the Vistrates platform.
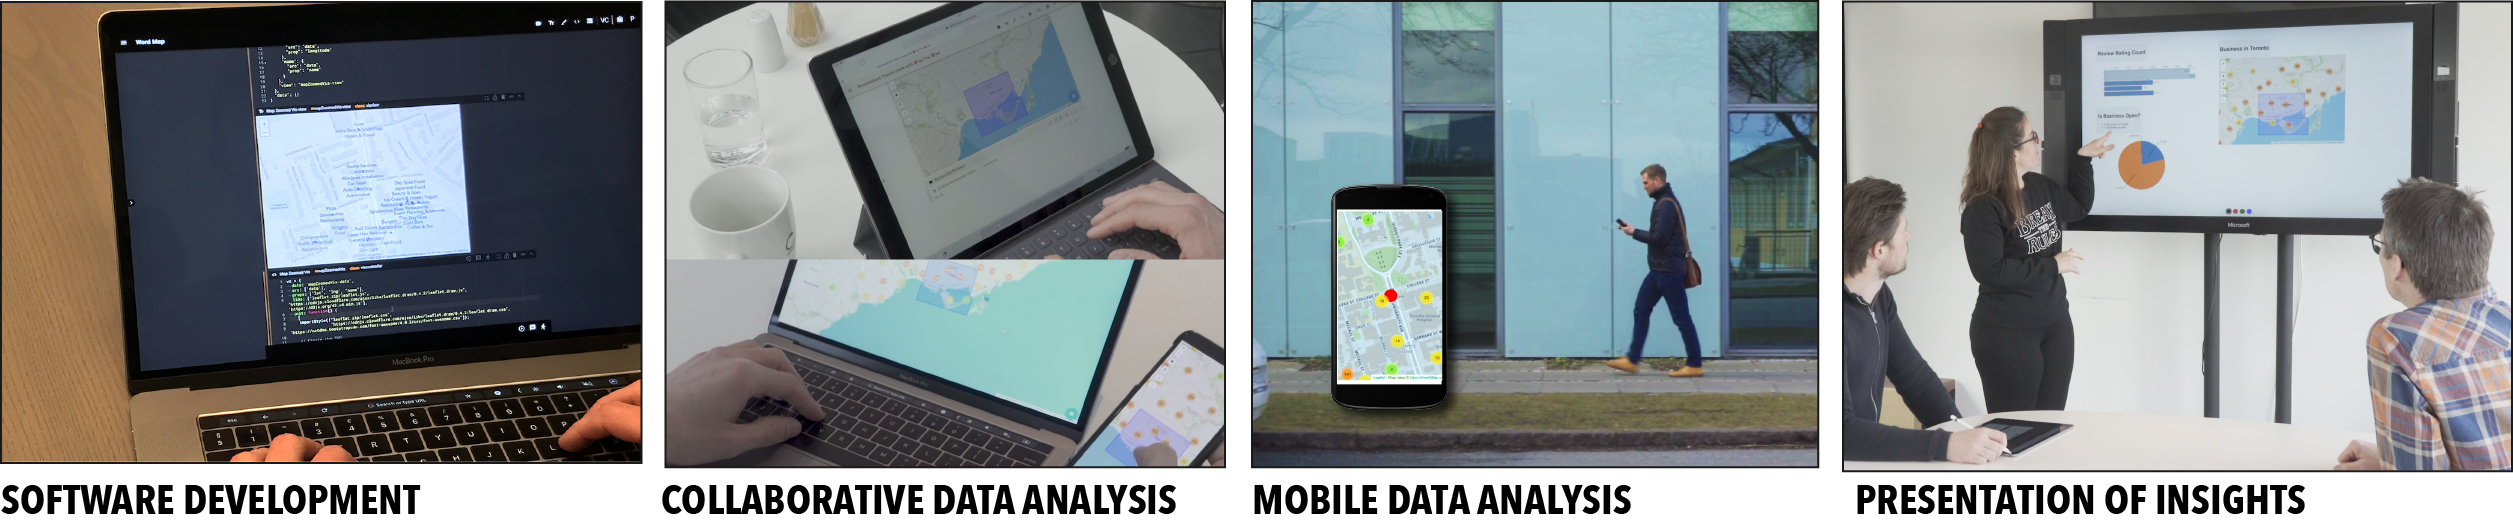
Figure 1: An overview of Vistrates’ versatile features for data analytics.
What is Vistrates and why is it needed?
Current tools for data analysis are optimized for specific analytical tasks. Tableau is used for exploration of data and presentation of stories from the data. Adobe’s Data Illustrator is used for creating custom narrative visualizations. Microsoft’s ChartAccent is ideal for annotating charts in a data-driven fashion. Jupyter notebooks enable exploratory analysis through interactive programming. However, to be truly useful, each of these tools need to be used together by teams of analysts working on different devices (laptops, tablets, or even smartphones). This means when using these tools the team needs to come to a collective compromise about the protocols, jobs, and results expected to reach the final outcome.
Vistrates is built on top of existing web platforms (Codestrates and Webstrates) that promote shareability, distributability, and malleability of applications. It adapts these platforms to support data analysis and promotes unification and interoperability between interfaces, devices, and users. Vistrates in essence is built on two ideas:
- Flexible user interface: The user interface of Vistrates is flexible and can be changed based on the analytical activity in question. During visual exploration, for example, the interface can be turned into a dashboard (an abstraction) to filter and analyze data across multiple attributes. Similarly, during storytelling, the interface can be converted into a slideshow along with speaker notes to enable presentations (Figure 1—right). A vistrate can even appear as an interactive visualization tool to an end-user.
- Composable, extensible, & reusable components: Each vistrate is made of analytical components that feed each other and together support a complex activity. A classification method can be an analytical component with a data output representing the class/group of each data point. A bar chart component can take the input from the classification and provide a visual output of the groups. Furthermore, components are editable, reusable, and extensible.
What does a vistrate look like?
A vistrate is simply a web document containing executable code, text, and media. Like Google Docs, vistrate documents are inherently collaborative—you can share a URL with your teammate to work together on a document. Like Jupyter notebooks, a vistrate is an interactive programming environment with code cells integrated with cells of rich text. The building block of a vistrate is a component consisting of a controller (written in Javascript), a state specification (resembles JSON), and a view (in HTML). Each component can get input from and output data to other components along with maintaining the state (such as user interaction) in the state specification.
More levels of UI abstractions can be accessed in a Vistrate. For instance, in contrast to a linear layout for interactive programming, a dashboard abstraction can be used to show all component views together in a grid layout. A mobile abstraction level is also present for a small-screen device. Figure 2 shows these different abstractions for a crime analysis scenario.

Figure 2: Different user interface abstractions of Vistrates during crime analytics. Figure shows dataflow (pipeline), dashboard, development, and mobile views (left to right).
Vistrates in Action
We illustrate the power of the Vistrates platform through a travel journalism scenario: a freelance travel writer works with data scientists and software engineers at a travel guide company to create custom travel plans using the Vistrates platform. In this scenario, we see different UI abstractions, collaborative activities, and multiple devices, with the software engineer adding new analytical components based on the requirements of the travel writer. This ubiquitous analytics scenario can be seen in action here: https://www.youtube.com/watch?v=nMmiWBJoJUc (viewing time: 8 minutes).
Using Vistrates for your own analyses
Vistrates is now available for public use along with basic analytical components that we developed over the last few months—including components for data aggregation, filtering, charting, interaction, and presentation. Vistrates can also encapsulate existing web frameworks such as Vega-lite and Plotly.js through the component definition with little overhead. Vistrates is flexible enough to act as a testing environment for future advances in the visualization and data analytics communities. We, therefore, solicit contributions from the community to the Vistrates platform; after all, it is beyond us five researchers to carry on the vision of Vistrates into the future. As a first step, we are releasing vistrates.org with a collection of examples built on Vistrates.
Links
Paper: https://karthikbadam.github.io/assets/data/vistrates.pdf
Video: https://www.youtube.com/watch?v=nMmiWBJoJUc
Public resources: vistrates.org
Publication:
Sriram Karthik Badam, Andreas Mathisen, Roman Rädle, Clemens Nylandsted Klokmose, Niklas Elmqvist (2019). Vistrates: A Component Model for Ubiquitous Analytics. IEEE Transactions on Visualization & Computer Graphics, 2019.