When David Meets Goliath: Using smartwatches and large displays together for data analysis
By Karthik Badam, Tom Horak, Niklas Elmqvist, and Raimund Dachselt
Large touchscreens are common in meeting rooms and collaborative spaces in many modern offices. When analyzing data, they help groups of analysts to work together; for instance, to track the bottlenecks in a city’s traffic and plan detours in real time (e.g., CATT lab at University of Maryland). In these situations, the display offers a large space to represent the data using visual representations such as maps, barcharts, and line graphs. However, large displays are public and often shared between multiple users by virtue of their size, which makes it hard for individuals to work independently on such a display.
In a previous blog post, we introduced methods for large wall displays where multiple analysts could make sense of data using gestures and even their bodies as input devices. In this new research project, we have developed a way to combine large displays with smartwatches for visual data analysis. In particular, we propose an idea where the smartwatch acts as personal mediator and storage container during data analysis. In a research paper at the prestigious ACM CHI conference, we demonstrate how this combination of a very small display—David—and a very large one—Goliath—can be applied to data-driven crime analysis.
Why Large Displays and Smartwatches?
Large vertical displays are devices with a display height comparable to an average human height like a whiteboard or a chalkboard, but interactive. Similar to such boards, large vertical displays invite groups of people to interact with them. They can also display a lot of information by virtue of their size, ideal for analyzing large datasets with many attributes. To augment this display, there are multiple options for secondary devices—for example, handheld smartphones and tablets have been used in the past.
In contrast to the alternatives, smartwatches are not just significantly smaller: they are lightweight and non-intrusive. Being wearables, they can free the user’s hands to interact with the large display. Since users are aware of the watch’s position on their body, they enable eyes-free, on-body interactions where the user can interact with the watch without actually looking at it. Overall, smartwatches can help multiple analysts work with a single large display without being obtrusive.
When Smartwatches meet Large Displays
Given these benefits, we developed a conceptual framework to use smartwatches with a large vertical display. This comprises of two basic concepts: (1) item sets: groups of items that can transferred from one device to another. This can be, for example, data points—crimes within a city during crime analysis, and (2) connective areas: parts of the interface that provide item sets to transfer to the secondary device (e.g., a part of a chart, labels etc.). These two concepts describe the connection between the two devices in terms of what and where. Our framework also introduces interaction techniques (how) and feedback mechanisms to utilize the two devices for data analysis.
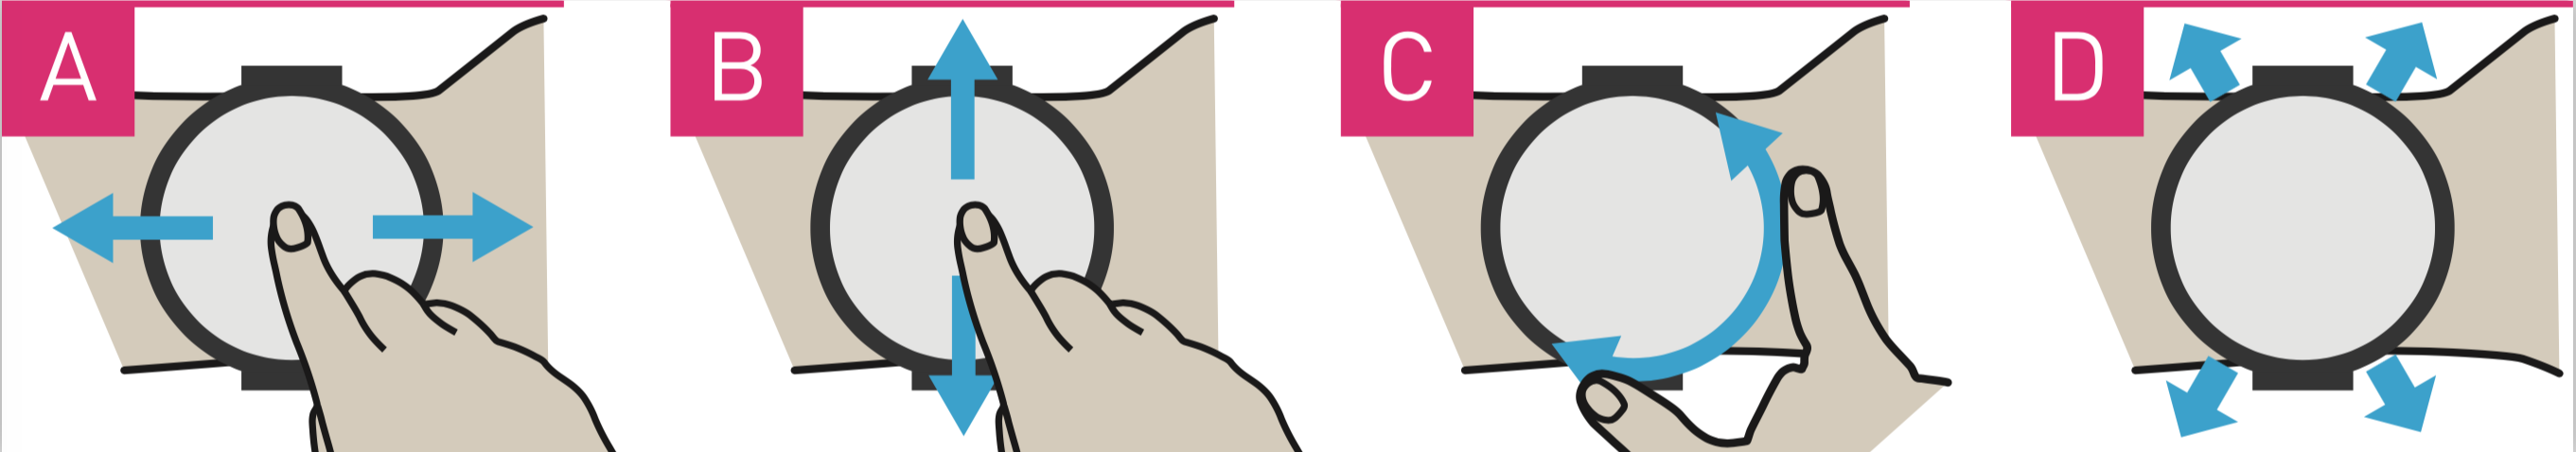
Figure 1: Actions on a smartwatch: (a) swiping horizontally, i.e., along the arm for transferring content; (b) swiping vertically or (c) rotating a physical control for scrolling through stored content; and (d) moving the arm for pointing interaction.
In particular, we present two interaction types based on the primary actions possible on a smartwatch (Figure 2),
- Pull and push: Information on one device can be pulled/pushed to the other. On the smartwatch, these interactions are performed by swiping the watch along the arm (the proximodistal axis—Figure 1A). Swiping motion towards the shoulder (Figure 2A) pulls content from the large display onto the smartwatch and vice versa, swiping towards the hand can push content back (Figure 2C).
- Preview: Information present on one device is previewed temporarily on the other device. Touching a large display previews the current item set of the smartwatch on the visualization present on the large display. Similarly, tapping the large display twice makes the preview last for a few seconds (Figure 2B).
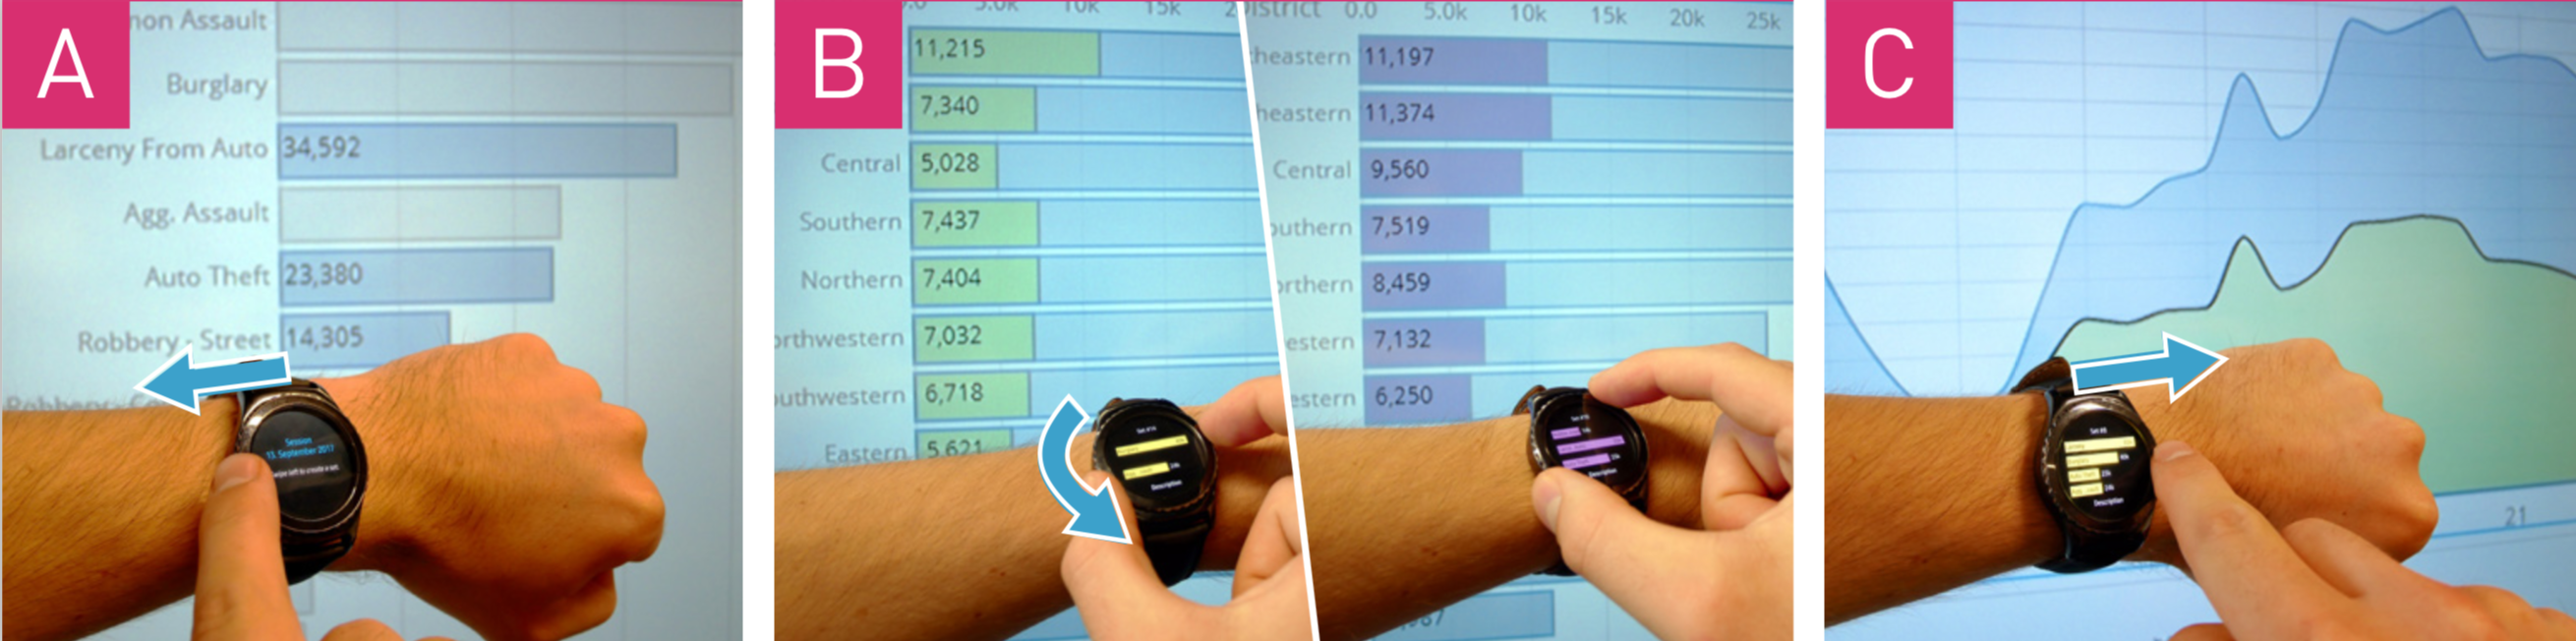
Figure 2: Pulling, previewing, and pushing of sets.
Apart from these two interactions, the smartwatch supports navigation of item sets collected by a user by swiping vertically (Figure 1B) or using the native navigation hardware of the watch—the rotatable bezel in the Samsung Gear (Figure 1C) or the crown of the Apple Watch. For example, in crime analysis, the analysts can compare crime patterns from two different locations in the city using this feature (Figure 2B). Touch-and-hold on the smartwatch enables a manipulation mode where the item set can be modified using preset options (Figure 3). Overall, these concepts and interactions can be applied to many visual analysis tasks; in fact, they are compatible with the task taxonomies from Yi et al. (2008) and Brehmer and Munzner (2013). See page 5 of our paper for more information.

Figure 3: Changing the content of a configuration set corresponding to an axis dimension, and pushing this to the large display.
Fluid Interaction and Better Insights
To understand the effectiveness of our ideas, we evaluated an implementation of the concepts against a setup that contains only a large display through a user study of 10 participants. Our results show that the combining the two devices led to flexible user movements (workflows) in front of the large display and better insights. The participants also felt that combination was more suitable for visual analysis.
- Participants showed two unique workflows: (1) moving back and forth in front of the large display to see the entire large display at once, while using smartwatch to interact, and (2) performing remote interaction with smartwatch to avoid too many physical movements.
- Participants developed more detailed observations, thanks to these two workflows. When using only the large display, participants had to spend too much effort working with the display; in contrast, the smartwatch simplified the process.
See our video for a demonstration of these results.
The Future: Unifying Technologies into an Analytical Ecosystem
In 1991, Mark Weiser, a chief scientist at Xerox, envisioned a future where our devices are used together seamlessly for everyday tasks—beginning the field of ubiquitous computing. It is now time to integrate our device technologies into a cohesive ecosystem that can enable us to make sense of data anywhere and anytime. Our framework exposes an initial step towards this vision of ubiquitous analytics. In the future, more technologies such as touch, speech, body interaction, and augmented/virtual reality will be integrated into this ecosystem.
Resources
Paper: http://legacydirs.umiacs.umd.edu/~elm/projects/david-goliath/david-goliath.pdf
Video: https://www.youtube.com/watch?v=DYSvA_Hn39o